Looking for ISA ideas? Don’t overlook this data detail
Performance data for investment trusts is about to get a little weird, says a Kepler analyst, who points out that the impact of Covid in 2020 and interest rates in 2022 are about to show up in March 2025 figures.
14th February 2025 14:14
by Alan Ray from Kepler Trust Intelligence

This content is provided by Kepler Trust Intelligence, an investment trust focused website for private and professional investors. Kepler Trust Intelligence is a third-party supplier and not part of interactive investor. It is provided for information only and does not constitute a personal recommendation.
Material produced by Kepler Trust Intelligence should be considered a marketing communication, and is not independent research.
We’re rapidly approaching that time of year when investors start thinking about ISA investments, and while everyone is familiar with the disclaimers about past performance not being a reliable indicator of future returns, for many of us past performance is certainly one element taken into account when making investment decisions.
- Invest with ii: Buy Investment Trusts | Top UK Shares | Open a Trading Account
This year, the performance tables around the end of March are going to feature two events that continue to dominate the investment landscape, both of which will dramatically alter the way performance tables appear. First, the pandemic, which in late March 2020 saw markets bottom out after significant falls. That means that the starting point for five-year performance is, in the next few weeks, going to be rebased lower dramatically and the five-year numbers for virtually all investment trusts are therefore going to look significantly better than they do now.
Second, market response to interest rate rises in 2022 really began in March 2022, and this is going to reshape the three-year performance figures. Five and three years are, as we know, the main performance periods that industry data defaults to and they are heavily scrutinised by investors.
One can use that knowledge in a few ways. The simplest, which is what most of us should be doing, is to acknowledge that this shake-up is about to occur and allow for it in any analysis of performance. Next, a more complex thought is that this knowledge may help explain other investors’ behaviour. As we will see in some examples below, the effect on performance tables is quite striking and it’s not hard to imagine it turning some people’s heads. Could this influence discounts?
Many years ago, anticipating what performance tables would be like in a month or two’s time was a trading strategy regularly employed by some investors. We think that the way trading and flows in and out of investment trusts work these days makes this less likely, but we can’t say for sure.
Furthermore, the analysis might help us learn a little bit more about the different trusts and investing more generally. The pandemic was a highly correlated event where investment trusts, and really all risk asset classes, fell as one. In contrast, the interest rate event saw a dispersion of returns. Again, both these facts have been heavily referenced in performance commentary over the years, so they won’t be startling insights. But as we approach the twin anniversaries it’s helpful just to mark the calendar and remember what happened.
For those for whom these events were their first encounter with a big market fall, we suggest they make a note, as in the years to come these events will be a big element of what we call ‘experience’ and for those who have seen it all before, it’s useful to reflect that actually, no we haven’t seen it all before, as the nature of these two events was very different to anything else. Either way, it’s helpful to take a moment to remember, as it’s one thing to see it on a chart, it’s another thing to have been there at the time.
With the above out of the way, let’s focus on some examples. What we don’t want to do is weigh readers down with a deep analysis that implies that any of what follows is complex. It isn’t, and here’s a chart that explains everything else we are going to look at. This is the NAV total return of the Morningstar Europe peer group for the five years beginning in January 2020. We can see that big dip in markets in March and the two straight lines help illustrate the dramatic shift that is about to occur at this starting point for five-year performance numbers.
FIVE-YEAR PERFORMANCE
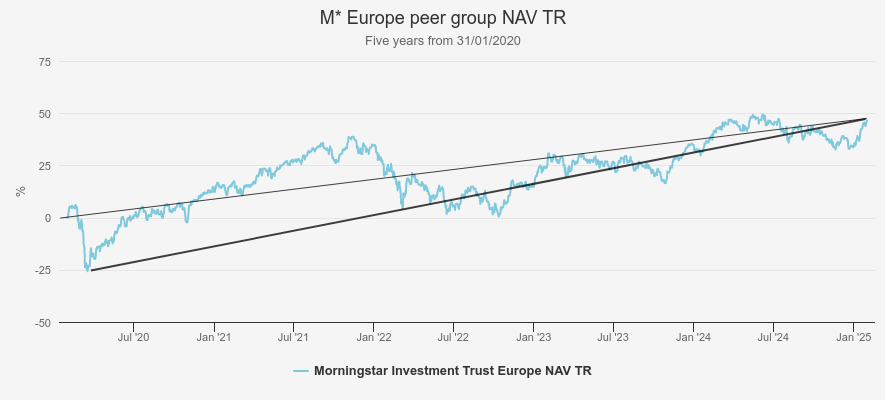
Source: Morningstar. Past performance is not a reliable indicator of future results
The thicker of the two straight black lines above covers a period of 58 months to the end of January 2025, so if we just assume that between the end of January and the end of March 2025, markets don’t move up or down very much, we can use that period to estimate what five-year performance tables will look like by the end of March. The table below does that for the underlying trusts in the Europe peer group. The first column labelled ‘Pre-Pandemic’ is the actual five-year return to the end of January 2025. The second, ‘Pandemic’ is the 58-month period that starts at the low point.
We’ve added a further column ‘Post-Pandemic’ which takes its start point at the end of April 2020. This gives us a further idea of what five-year performance tables will look like by late spring 2025, although of course the further we project into the future, the greater the probability of events upending that analysis become. We’ve chosen Europe as it’s a reasonably sized peer group of trusts with, broadly, the same equity growth strategy. We hope the individual managers can forgive us for that statement, but it’s a fair generalisation in this context. And, as we will see later, there are some notable differences between the trusts in this group. To be strictly accurate, our 58-month period actually begins on 20/03/2020. Not all markets bottomed on exactly the same day, but this date is a reasonable approximation.
EUROPE FIVE-YEAR PROJECTED PERFORMANCE
| Ticker | Pre-Pandemic 01/02/2020 31/01/2025 NAV TR (Cumulative) | Pandemic 20/03/2020 31/01/2025 NAV TR (Cumulative) | Post-Pandemic 30/04/2020 31/01/2025 NAV TR (Cumulative) | |
| Baillie Gifford European Growth Ord (LSE:BGEU) | BGEU | 24 | 54 | 26 |
| BlackRock Greater Europe Ord (LSE:BRGE) | BRGE | 66 | 118 | 81 |
| European Opportunities Trust (LSE:EOT) | EOT | 12 | 59 | 29 |
| Fidelity European Trust Ord (LSE:FEV) | FEV | 69 | 107 | 81 |
| Henderson European Trust Ord (LSE:HET) | HET | 68 | 119 | 83 |
| JPMorgan European Growth & Income Ord (LSE:JEGI) | JEGI | 73 | 135 | 99 |
Source: Morningstar. Past performance is not a reliable indicator of future results.
The fact that the Pandemic column above shows higher figures across the board won’t come as a surprise. It’s easy to forget though that lowering the starting point by even a little bit can have such a powerful effect on percentage gains. If something halves in value, that’s a 50% fall, whereas to get back to the starting point requires a 100% increase. That is such a simple piece of mathematics that it can be easy to forget, and this writer has seen experienced analysts and fund managers tripped up by it.
As we note above, while we don’t know exactly what effect these numbers might have on investor behaviour, it’s not hard to imagine some of those very high, greater than 100% numbers above, catching some investors’ eye. As the third column shows, the air rapidly comes out of those numbers as markets quite quickly bounced back during 2020.
Enduringly, the most popular investment trust sector is UK Equity Income and the next table performs exactly the same exercise for that sector. Again, it’s a striking reminder of how lowering the start point has a dramatic effect on subsequent percentage gains.
UK EQUITY INCOME FIVE-YEAR PROJECTED PERFORMANCE
| Ticker | Pre-Pandemic 01/02/2020 31/01/2025 NAV TR (Cumulative) | Pandemic 20/03/2020 31/01/2025 NAV TR (Cumulative) | Post-Pandemic 30/04/2020 31/01/2025 NAV TR (Cumulative) | |
| Finsbury Growth & Income Ord (LSE:FGT) | FGT | 29 | 61 | 42 |
| BlackRock Income and Growth Ord (LSE:BRIG) | BRIG | 34 | 92 | 59 |
| Merchants Trust Ord (LSE:MRCH) | MRCH | 44 | 154 | 89 |
| Edinburgh Investment Ord (LSE:EDIN) | EDIN | 54 | 132 | 95 |
| Diverse Income Trust Ord (LSE:DIVI) | DIVI | 26 | 74 | 39 |
| CT UK High Income Ord (LSE:CHI) | CHI | 27 | 98 | 54 |
| Chelverton UK Dividend Trust Ord (LSE:SDV) | SDV | 0 | 157 | 68 |
| CT UK Capital and Income Ord (LSE:CTUK) | CTUK | 22 | 108 | 58 |
| abrdn Equity Income Trust Ord (LSE:AEI) | AEI | 11 | 93 | 48 |
| British & American Ord (LSE:BAF) | BAF | 40 | 66 | 55 |
| Schroder Income Growth Ord (LSE:SCF) | SCF | 32 | 103 | 64 |
| JPMorgan Claverhouse Ord (LSE:JCH) | JCH | 30 | 108 | 71 |
| Dunedin Income Growth Ord (LSE:DIG) | DIG | 28 | 80 | 45 |
| Murray Income Trust Ord (LSE:MUT) | MUT | 27 | 80 | 46 |
| City of London Ord (LSE:CTY) | CTY | 40 | 105 | 69 |
| Temple Bar Ord (LSE:TMPL) | TMPL | 36 | 169 | 113 |
| Shires Income Ord (LSE:SHRS) | SHRS | 26 | 96 | 51 |
| Lowland Ord (LSE:LWI) | LWI | 23 | 109 | 69 |
| Law Debenture Corporation Ord (LSE:LWDB) | LWDB | 67 | 149 | 109 |
Source: Morningstar. Past performance is not a reliable indicator of future results
Finally, the next table repeats the exercise for the three Asian sectors of smaller companies, income strategies, and growth strategies, with the three groups shaded to distinguish them. Again, the first two columns show that there were very few places to hide in that period, as every trust has a higher ‘Pandemic’ performance number. The third column though hints that some trusts may have had a better time since then and we’ll come on to that when we look at the impact of interest rates next.
ASIA FIVE-YEAR PROJECTED PERFORMANCE
| Asia | Ticker | Pre-Pandemic 01/02/2020 31/01/2025 NAV TR (Cumulative) | Pandemic 20/03/2020 31/01/2025 NAV TR (Cumulative) | Post-Pandemic 30/04/2020 31/01/2025 NAV TR (Cumulative) |
| abrdn Asia Focus plc (LSE:AAS) | AAS | 64 | 112 | 93 |
| Fidelity Asian Values Ord (LSE:FAS) | FAS | 65 | 117 | 91 |
| Scottish Oriental Smaller Cos Ord (LSE:SST) | SST | 65 | 101 | 100 |
| abrdn Asian Income Fund Ord (LSE:AAIF) | AAIF | 44 | 85 | 63 |
| Henderson Far East Income Ord (LSE:HFEL) | HFEL | 6 | 31 | 14 |
| Invesco Asia Ord (LSE:IAT) | IAT | 51 | 91 | 63 |
| JPMorgan Asia Growth & Income Ord (LSE:JAGI) | JAGI | 32 | 52 | 36 |
| Schroder Oriental Income Ord (LSE:SOI) | SOI | 51 | 93 | 67 |
| Pacific Assets Ord (LSE:PAC) | PAC | 52 | 77 | 70 |
| Asia Dragon Ord (LSE:DGN) | DGN | 11 | 32 | 19 |
| Schroder AsiaPacific Ord (LSE:SDP) | SDP | 39 | 63 | 45 |
| Schroder Asian Total Return Inv. Company (LSE:ATR) | ATR | 59 | 94 | 67 |
| Pacific Horizon Ord (LSE:PHI) | PHI | 98 | 144 | 94 |
Source: Morningstar. Past performance is not a reliable indicator of future results
The next table uses the same format to look at how the interest rate anniversary will change the three-year performance of the European trusts. Again, focusing on the first two columns, the first one is actually three years and one month (i.e. 37 months), and the second is 34 months, timed more or less at the point markets peaked before rising interest rates took their toll. We can see here that the three trusts that we might describe as being more defensively positioned at the time, Fidelity European Trust Ord (LSE:FEV), Henderson European Trust Ord (LSE:HET), and JPMorgan European Growth & Income Ord (LSE:JEGI), did not see quite the same dramatic rebasing of their performance as a result of interest rate hikes. Although we would not describe any of these as thoroughly value-orientated, the latter two took on more value positions around this time, which performed better, and the first, FEV, tends to favour lower beta defensive stocks which again, performed better in 2022 than the index.
EUROPE THREE-YEAR PROJECTED PERFORMANCE
| Ticker | Pre-Interest Rates 01/01/2022 31/01/2025 NAV TR (Cumulative) | Interest Rates 31/03/2022 31/01/2025 NAV TR (Cumulative) | Post-Interest Rates 30/06/2022 31/01/2025 NAV TR (Cumulative) | |
| Baillie Gifford European Growth | BEGU | -26 | -4 | 18 |
| BlackRock Greater Europe | BRGE | -2 | 19 | 43 |
| European Opportunities Trust | EOT | 6 | 13 | 23 |
| Fidelity European Trust | FEV | 24 | 31 | 39 |
| Henderson European Trust | HET | 25 | 33 | 43 |
| JPMorgan European Growth & Income | JEGI | 27 | 36 | 46 |
Source: Morningstar. Past performance is not a reliable indicator of future results
But here’s the point, one could easily slip into looking at the table above and think that it was sending a signal that those three trusts mentioned above are in some way ‘better’. But because we know the context of this chart, we can say that some performed better than others because of their inherent characteristics. Understanding that BlackRock Greater Europe Ord (LSE:BRGE), which has a very notable longer-term track record, performs better in some circumstances might help an investor choose it, or lead an investor to Baillie Gifford European Growth Ord (LSE:BGEU) for its very considerable recovery potential in some of the higher growth names, or to European Opportunities Trust (LSE:EOT)for a return to its outstanding 20-year track record.
Strikingly, it’s a very different story for the UK Equity Income sector as the table below shows. Many of the stalwarts of this sector, taking City of London Ord (LSE:CTY)as an example, show very little effect from the interest rate-hiking cycle, with the before, during, and after performance figures all much the same. To our point above about ‘experience’, one thing to take away from this is that certain asset classes are interest rate sensitive in a fairly obvious way, property and infrastructure being good examples, but sensitivity in equities is more complex. If high-growth companies are achieving very high valuations based on earnings far in the future, then a small change in interest rates can have a dramatic impact, whereas companies with very reliable earnings today, which trade at lower valuations, may weather interest rates much better, even if one might think that because they have a dividend yield, they might be more vulnerable.
These more reliable companies tend to be the backbone of all the trusts below and thus weathered the cycle better. That’s not to say that some share prices haven’t suffered, and thus discounts have developed, but again, looking at performance through this lens might help an investor gain confidence that those discounts are an opportunity rather than a warning sign. Coming right up to date, a trust such as CT UK Capital and Income Ord (LSE:CTUK)has currently positioned itself to avoid very specific interest rate changes in future, such as those the manager perceives within UK high street banks and instead is looking for value and specialist financials further down the market-cap spectrum, which again shows that this sector is perhaps less sensitive that a superficial analysis might imply.
UK EQUITY INCOME THREE-YEAR PROJECTED PERFORMANCE
| Ticker | Pre-Interest Rates 01/01/2022 31/01/2025 NAV TR (Cumulative) | Interest Rates 31/03/2022 31/01/2025 NAV TR (Cumulative) | Post-Interest Rates 30/06/2022 31/01/2025 NAV TR (Cumulative) | |
| abrdn Equity Income Trust | AEI | 10 | 8 | 13 |
| BlackRock Income and Growth | BRIG | 25 | 24 | 28 |
| British & American | BAF | 45 | 124 | 67 |
| Chelverton UK Dividend Trust | SDV | -16 | -6 | 4 |
| City of London | CTY | 32 | 28 | 29 |
| CT UK Capital and Income | CTUK | 13 | 18 | 23 |
| CT UK High Income | CHI | 21 | 28 | 30 |
| Diverse Income Trust | DIVI | -1 | 3 | 8 |
| Dunedin Income Growth | DIG | 13 | 20 | 26 |
| Edinburgh Investment | EDIN | 38 | 37 | 43 |
| Finsbury Growth & Income | FGT | 14 | 23 | 30 |
| JPMorgan Claverhouse | JCH | 18 | 22 | 31 |
| Law Debenture Corporation | LWDB | 28 | 25 | 30 |
| Lowland | LWI | 14 | 16 | 24 |
| Merchants Trust | MRCH | 22 | 18 | 21 |
| Murray Income Trust | MUT | 11 | 15 | 21 |
| Schroder Income Growth | SCF | 24 | 18 | 22 |
| Shires Income | SHRS | 14 | 15 | 22 |
| Temple Bar | TMPL | 42 | 40 | 45 |
Source: Morningstar. Past performance is not a reliable indicator of future results
Returning to our last sample set, the Asian trusts, the next table repeats the interest rate analysis. What we know already is that Asian companies arrived in the rate-hiking cycle with relatively low debt and far fewer of the high-valuation companies that fell so far in Europe, and the US. This is particularly the case with smaller companies, as noted to us by the managers of both abrdn Asia Focus plc (LSE:AAS)and Fidelity Asian Values Ord (LSE:FAS), and their domestic earnings focus also helped shield them from the shock of rising rates. The table below clearly shows that there is very little effect from the start of the rate-hiking cycle on the performance of these trusts.
ASIA THREE-YEAR PERFORMANCE
| ASIA | TICKER | Pre-Interest Rates 01/01/2022 31/01/2025 NAV TR (Cumulative) | Interest Rates 31/03/2022 31/01/2025 NAV TR (Cumulative) | Post-Interest Rates 30/06/2022 31/01/2025 NAV TR (Cumulative) |
| abrdn Asia Focus plc | AAS | 15 | 20 | 26 |
| Fidelity Asian Values | FAS | 20 | 21 | 19 |
| Scottish Oriental Smaller Cos | SST | 38 | 45 | 44 |
| abrdn Asian Income Fund | AAIF | 12 | 11 | 18 |
| Henderson Far East Income | HFEL | 4 | -1 | 5 |
| Invesco Asia | IAT | 13 | 14 | 11 |
| JPMorgan Asia Growth & Income | JAGI | 7 | 11 | 12 |
| Schroder Oriental Income | SOI | 22 | 17 | 23 |
| Pacific Assets | PAC | 8 | 18 | 18 |
| Asia Dragon | DGN | -12 | -5 | -3 |
| Schroder AsiaPacific | SDP | 3 | 8 | 13 |
| Schroder Asian Total Return | ATR | 9 | 16 | 28 |
| Pacific Horizon | PHI | -13 | -5 | 3 |
Source: Morningstar. Past performance is not a reliable indicator of future results
Conclusion
At its simplest level, the analysis above just goes to show, in possibly too much detail, that it’s good to know what was happening around the start date of any performance analysis, as a few weeks, either way, can make a huge difference to what the data looks like. This is about to happen and investors with a date in their diary for some homework on ISA investments may wish to ensure they take a snapshot of performance tables before the big impact of the pandemic tilts the numbers and look at the two alongside each other.
Another version of this note could have been at least twice the length and included tables for every sector, but we’ve chosen some examples where first, the sectors are of a good size and provide a spread of examples and second don’t all march to the same tune and thus provide us with different responses to interest rates, if not the pandemic.
It also helps to show that not all big events are made the same, and while interest-rate hikes have cast a long shadow over many asset classes, the impact on equities varies according to which economies they face, what their balance sheets look like, and what their starting valuation was.
There is no special reason why these anniversaries require investors to take any particular action, but as we note above, they both form part of our investing experience and sometimes it’s just helpful to look back on events. Not a guide to the future, then, but perhaps helpful in guiding how we as investors respond to future events.
Kepler Partners is a third-party supplier and not part of interactive investor. Neither Kepler Partners or interactive investor will be responsible for any losses that may be incurred as a result of a trading idea.
These articles are provided for information purposes only. Occasionally, an opinion about whether to buy or sell a specific investment may be provided by third parties. The content is not intended to be a personal recommendation to buy or sell any financial instrument or product, or to adopt any investment strategy as it is not provided based on an assessment of your investing knowledge and experience, your financial situation or your investment objectives. The value of your investments, and the income derived from them, may go down as well as up. You may not get back all the money that you invest. The investments referred to in this article may not be suitable for all investors, and if in doubt, an investor should seek advice from a qualified investment adviser.
Full performance can be found on the company or index summary page on the interactive investor website. Simply click on the company's or index name highlighted in the article.
Important Information
Kepler Partners is not authorised to make recommendations to Retail Clients. This report is based on factual information only, and is solely for information purposes only and any views contained in it must not be construed as investment or tax advice or a recommendation to buy, sell or take any action in relation to any investment.
This report has been issued by Kepler Partners LLP solely for information purposes only and the views contained in it must not be construed as investment or tax advice or a recommendation to buy, sell or take any action in relation to any investment. If you are unclear about any of the information on this website or its suitability for you, please contact your financial or tax adviser, or an independent financial or tax adviser before making any investment or financial decisions.
The information provided on this website is not intended for distribution to, or use by, any person or entity in any jurisdiction or country where such distribution or use would be contrary to law or regulation or which would subject Kepler Partners LLP to any registration requirement within such jurisdiction or country. Persons who access this information are required to inform themselves and to comply with any such restrictions. In particular, this website is exclusively for non-US Persons. The information in this website is not for distribution to and does not constitute an offer to sell or the solicitation of any offer to buy any securities in the United States of America to or for the benefit of US Persons.
This is a marketing document, should be considered non-independent research and is subject to the rules in COBS 12.3 relating to such research. It has not been prepared in accordance with legal requirements designed to promote the independence of investment research.
No representation or warranty, express or implied, is given by any person as to the accuracy or completeness of the information and no responsibility or liability is accepted for the accuracy or sufficiency of any of the information, for any errors, omissions or misstatements, negligent or otherwise. Any views and opinions, whilst given in good faith, are subject to change without notice.
This is not an official confirmation of terms and is not to be taken as advice to take any action in relation to any investment mentioned herein. Any prices or quotations contained herein are indicative only.
Kepler Partners LLP (including its partners, employees and representatives) or a connected person may have positions in or options on the securities detailed in this report, and may buy, sell or offer to purchase or sell such securities from time to time, but will at all times be subject to restrictions imposed by the firm's internal rules. A copy of the firm's conflict of interest policy is available on request.
Past performance is not necessarily a guide to the future. The value of investments can fall as well as rise and you may get back less than you invested when you decide to sell your investments. It is strongly recommended that Independent financial advice should be taken before entering into any financial transaction.
PLEASE SEE ALSO OUR TERMS AND CONDITIONS
Kepler Partners LLP is a limited liability partnership registered in England and Wales at 9/10 Savile Row, London W1S 3PF with registered number OC334771.
Kepler Partners LLP is authorised and regulated by the Financial Conduct Authority.