Lloyds Banking Group: where the share price could go next
The Lloyds share price is moving at glacial pace, but at least it's in the right direction.
4th May 2021 08:48
by Alistair Strang from Trends and Targets
The Lloyds share price is moving at glacial pace, but at least it's in the right direction.

About the only word which can be fairly used to describe Lloyds Banking Group’s (LSE:LLOY) share price movements is “grudgingly”.
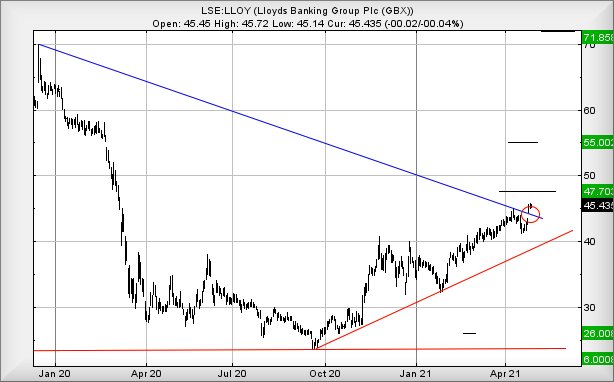
Three weeks ago, we gave criteria which argued for a cycle commencing which would take the share price up to 47.7p. The period since saw our criteria trigger, the share price mesmerically gaining a magical 2.06p in the process, soaring above our 43.8p trigger level to reach a high of 45.86p.
Movements are not impressive and there are signs the market is getting frustrated also.
- Lloyds Bank: surely the sluggish share price must rev up soon?
- Lloyds Bank’s results are a recovery play in action
- Why reading charts can help you become a better investor
Last week, the market opted to “gap” Lloyds’ share price up at the open (circled on chart below), doubtless due to news of the bank’s profits soaring, news which was echoed across Europe with several other banks reaping a Covid19 dividend.
We’re still banging a drum which favours price recovery toward 47.7p next, with secondary, if exceeded, calculating at 55p. If opting to play safe, movements next above 45.86p should herald continue slow recovery to our target level.
There’s a reasonable chance of some hesitation around the 50p level on the way up, this particular number perhaps proving to be one of these things called a ‘psychological barrier’, maybe even believable as many traders will tend to distrust the glacial pace with which the price is moving.
Arithmetically, we lack reasons to anticipate issues at the 50p level, but suspect nerves shall play their part in slowing things down.
For it all to go very wrong, Lloyds’ share price now needs to weaken below 37p to provoke outright panic. Visually, we’d raise an eyebrow even with weakness below 44p as this risks a retreat below the Blue downtrend. While this would not crush hopes for the future, such a movement would tend to confirm that the slow pace of travel is expected to continue.

Source: Trends and Targets. Past performance is not a guide to future performance
Alistair Strang has led high-profile and 'top secret' software projects since the late 1970s and won the original John Logie Baird Award for inventors and innovators. After the financial crash, he wanted to know 'how it worked' with a view to mimicking existing trading formulas and predicting what was coming next. His results speak for themselves as he continually refines the methodology.
Alistair Strang is a freelance contributor and not a direct employee of Interactive Investor. All correspondence is with Alistair Strang, who for these purposes is deemed a third-party supplier. Buying, selling and investing in shares is not without risk. Market and company movement will affect your performance and you may get back less than you invest. Neither Alistair Strang or Interactive Investor will be responsible for any losses that may be incurred as a result of following a trading idea.
These articles are provided for information purposes only. Occasionally, an opinion about whether to buy or sell a specific investment may be provided by third parties. The content is not intended to be a personal recommendation to buy or sell any financial instrument or product, or to adopt any investment strategy as it is not provided based on an assessment of your investing knowledge and experience, your financial situation or your investment objectives. The value of your investments, and the income derived from them, may go down as well as up. You may not get back all the money that you invest. The investments referred to in this article may not be suitable for all investors, and if in doubt, an investor should seek advice from a qualified investment adviser.
Full performance can be found on the company or index summary page on the interactive investor website. Simply click on the company's or index name highlighted in the article.