Lloyds Bank: where will the stagnant share price go?
The share price continues to languish in the gutter. Our chartist looks for a key trigger level.
24th August 2020 09:58
by Alistair Strang from Trends and Targets
The share price continues to languish in the gutter. Our chartist looks for a key trigger level.

Lloyds Bank (LSE:LLOY)
Following my little brush with mortality* last weekend, questioning whether things can come back from the dead is probably in particularly poor taste.
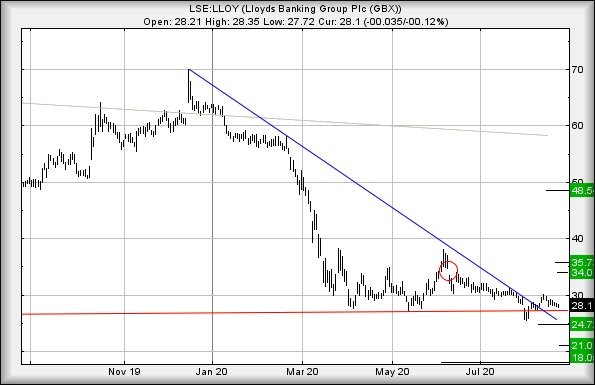
Unfortunately, the sentiment applies to Lloyds Banking Group (LSE:LLOY) as the share price continues to languish in the gutter, despite recently breaking across its own ruling blue downtrend.
Since the trend break, nothing interesting has occurred!
It looks like 30.9p should now be regarded as presenting a reasonable trigger level to promote some price movements.
While presently trading around 28p, this may feel an impossible ambition but we're inclined to take some (slight) hope from the respect paid to the long-term red uptrend which dates back eight years.
The current situation suggests movement above 30.9p should now attempt an initial 34p with secondary, if exceeded, at a mildly more interesting 35.7p.
Our interest in the 35.7p level may prove important as closure above 35.7p should be significant, tipping a pretty major domino in a longer-term price movement cycle which 'risks' now heading to 48p as a major point of interest.
Of course, the red uptrend also presents a threat, now suggesting any new weakness below 27.5p could cause the share to retreat to an initial 24.7p with secondary, if broken, at a bottom (hopefully) of 21p.
For the present, we're inclined to mild optimism, if only thanks to the share price having so far avoided the option of closing a session below the point of trend break.
This tends to suggest the price is awaiting sufficient reason to actually start moving again.
*an unpleasant cardiac event, a surprise rare side effect of a type of chemotherapy.

Source: Trends and Targets Past performance is not a guide to future performance
Alistair Strang has led high-profile and "top secret" software projects since the late 1970s and won the original John Logie Baird Award for inventors and innovators. After the financial crash, he wanted to know "how it worked" with a view to mimicking existing trading formulas and predicting what was coming next. His results speak for themselves as he continually refines the methodology.
Alistair Strang is a freelance contributor and not a direct employee of Interactive Investor. All correspondence is with Alistair Strang, who for these purposes is deemed a third-party supplier. Buying, selling and investing in shares is not without risk. Market and company movement will affect your performance and you may get back less than you invest. Neither Alistair Strang or Interactive Investor will be responsible for any losses that may be incurred as a result of following a trading idea.
These articles are provided for information purposes only. Occasionally, an opinion about whether to buy or sell a specific investment may be provided by third parties. The content is not intended to be a personal recommendation to buy or sell any financial instrument or product, or to adopt any investment strategy as it is not provided based on an assessment of your investing knowledge and experience, your financial situation or your investment objectives. The value of your investments, and the income derived from them, may go down as well as up. You may not get back all the money that you invest. The investments referred to in this article may not be suitable for all investors, and if in doubt, an investor should seek advice from a qualified investment adviser.
Full performance can be found on the company or index summary page on the interactive investor website. Simply click on the company's or index name highlighted in the article.