Lloyds Bank shares and a barometer for the UK economy
23rd May 2022 07:38
by Alistair Strang from Trends and Targets
After many years of reliably measuring the strength of Britain's economy, independent analyst Alistair Strang's barometer could have a positive read-across for Lloyds Banking Group shares.

I’ve mentioned a chum several times over the years, his business being a pretty good barometer of how trade activity is in the UK. If his pre-demolition survey business is doing well, it’s generally a pretty good indication we should anticipate the markets being buoyant and conversely, if he’s quiet, to anticipate trouble. He’s now taking on more staff for the first time in 10 years, when the penny dropped he risked losing contracts due to needing to start a booking schedule for 2023.
Our thinking is fairly simple. If he’s busy, the construction industry intends to be busy, material demand will be high, pay rates will be high, and all the burger vans which litter roadsides will be busy. Everyone benefits, just ‘cos my chum is wandering around taking photo’s, extracting material samples and scrawling copious notes in shopping centres, factory units, tower blocks, schools, and rather a lot of hospitality businesses too.
So, with all this frothy and optimistic discussion for the future, why the heck is the UK’s retail banking sector managing to remain in the pits?
Prices everywhere are going up, unless, of course, they are share prices. And Lloyds Banking Group (LSE:LLOY) remains at the forefront, managing to do very little against a backdrop of hope for the future.
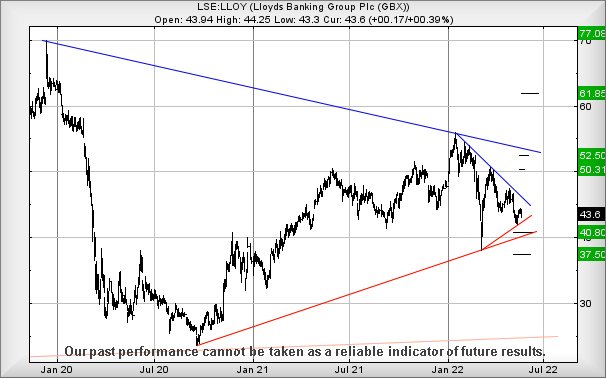
Perhaps some slight hope may be taken from our analysis three weeks ago, the one where we speculated on potential reversal from 45.25 to 43p (which happened) with a secondary target, should 43p break, down at 40.6p and hopefully a bounce.
The share did indeed break below our 43p, even managing to close below this initial target, but a visit to 40.6p has been noticeably absent. Perhaps this is an implication of some hidden strength, perhaps it’s a timing issue. We’re inclined to suspect the “hidden strength” theory.
- ii view: Lloyds Bank chiefs full of cautious optimism
- Lloyds Banking Group shares and a risk of weakness
- Why reading charts can help you become a better investor
Currently trading at around 43.6p, Lloyds Bank needs to trade above 46.4p to give the first indication of a trigger for happier times ahead.

Source: Trends and Targets. Past performance is not a guide to future performance
Above 46.4p risks triggering share price recovery toward an initial 50.3p with secondary, if exceeded, a slightly more useful 52.5p.
The secondary represents what we suspect shall prove a key point in Lloyds future history as closure above this level should prove a really big deal, making it possible to speculate on a longer term 77p without attempting to conceal a hysterical giggle.
Perhaps all this optimism is quite a heavy weight to dump on the shoulders of our chum with his clipboard and camera, but over the years we’ve noticed a distinct (and safe) pattern, when he gets busy, the stock market starts to do well in the months following.
Alistair Strang has led high-profile and "top secret" software projects since the late 1970s and won the original John Logie Baird Award for inventors and innovators. After the financial crash, he wanted to know "how it worked" with a view to mimicking existing trading formulas and predicting what was coming next. His results speak for themselves as he continually refines the methodology.
Alistair Strang is a freelance contributor and not a direct employee of Interactive Investor. All correspondence is with Alistair Strang, who for these purposes is deemed a third-party supplier. Buying, selling and investing in shares is not without risk. Market and company movement will affect your performance and you may get back less than you invest. Neither Alistair Strang or Interactive Investor will be responsible for any losses that may be incurred as a result of following a trading idea.
These articles are provided for information purposes only. Occasionally, an opinion about whether to buy or sell a specific investment may be provided by third parties. The content is not intended to be a personal recommendation to buy or sell any financial instrument or product, or to adopt any investment strategy as it is not provided based on an assessment of your investing knowledge and experience, your financial situation or your investment objectives. The value of your investments, and the income derived from them, may go down as well as up. You may not get back all the money that you invest. The investments referred to in this article may not be suitable for all investors, and if in doubt, an investor should seek advice from a qualified investment adviser.
Full performance can be found on the company or index summary page on the interactive investor website. Simply click on the company's or index name highlighted in the article.