The Investment Outlook: introduction and house view
In our latest Investment Outlook we share our latest house view, our scenarios around the US presidential election and a series of topical perspectives from our asset class experts.
25th October 2024 09:35
by Peter Branner from Aberdeen

As I look ahead to the end of the year, I can see it’s going to be an interesting time. A lot’s going on in both the political and economic world and we’re hard at work digesting these developments to figure out what they mean for us as investors.
At the end of last month, China announced fresh measures to support its struggling economy. Chinese stock markets roared back to life but it’s too early to say whether these gains are sustainable.
Escalation of the conflict in the Middle East has been a tragic development. While the failure of peace efforts has cost even more lives, we’ve been asking ourselves what this means for commodity prices, supply chains and volatility in general.
But arguably the biggest event this quarter will be the US presidential election next month. I don’t need to tell you about its importance for the world. Our economists have been analysing multiple scenarios because the race for the White House is such a close contest.
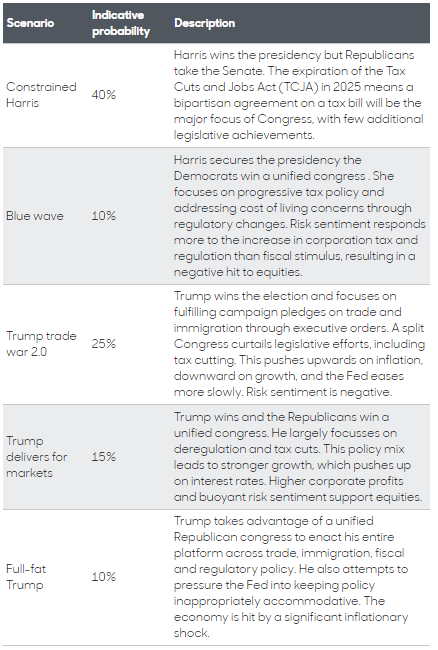
Kamala Harris may lead in the national polls, but Donald Trump has advantages in the electoral college voting system and higher public approval on the economy. Our election prediction shows a 50% chance of either candidate winning but we have 5 specific scenarios addressed below.
Harris is proposing a more fiscally expansive policy platform, including tax credits for families and first-time house buyers, higher corporation tax and increased business regulation.
However, without a unified Congress, implementing much of Harris’ agenda is unlikely. We’ve assigned a 10% probability to this outcome. A Harris administration with a divided Congress – a 40% probability – may still pass a watered-down version of her agenda.
On the other hand, multiple versions of a Trump presidency exist, depending on the Congressional elections and his governing style. Much of Trump’s protectionist trade agenda can be passed with executive orders, allowing more scope for implementation.
Amid more uncertainty, we see a 25% probability of a trade war, 15% for a market-friendly outcome involving tax cuts and deregulation, and a 10% probability of a volatile scenario with both tax cuts and deregulation, but also protectionism and politicised monetary policy. We have summarised the 5 scenarios in the table below:
US electoral scenarios

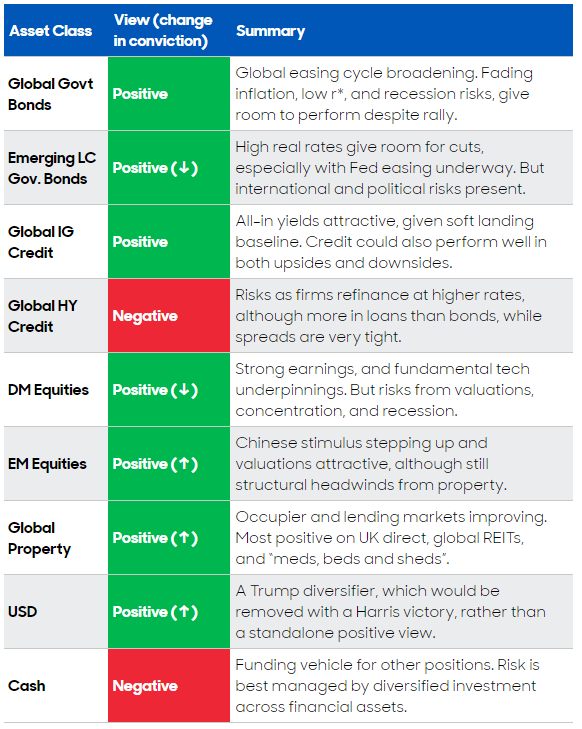
Looking further afield, we actually remain optimistic about stocks and bonds over a 12-18 month horizon which is what our house view is looking at in our updates. We’ve also updated our positive outlook on real estate and as a hedge to the election outcome we have introduced a positive allocation to the US dollar. Here’s a summary by asset class:
abrdn House View

Source: abrdn, Oct 2024. The views expressed should not be construed as advice or an investment recommendation on how to construct a portfolio or whether to buy, retain or sell a particular investment.
Peter Branner is chief investment officer at abrdn.
ii is an abrdn business.
abrdn is a global investment company that helps customers plan, save and invest for their future.
These articles are provided for information purposes only. Occasionally, an opinion about whether to buy or sell a specific investment may be provided by third parties. The content is not intended to be a personal recommendation to buy or sell any financial instrument or product, or to adopt any investment strategy as it is not provided based on an assessment of your investing knowledge and experience, your financial situation or your investment objectives. The value of your investments, and the income derived from them, may go down as well as up. You may not get back all the money that you invest. The investments referred to in this article may not be suitable for all investors, and if in doubt, an investor should seek advice from a qualified investment adviser.
Full performance can be found on the company or index summary page on the interactive investor website. Simply click on the company's or index name highlighted in the article.