interactive investor launches new ii Trading Index
Our new index shows net inflows into UK stocks rose 836% month-on-month in June ahead of the general election, while appetite for investment trusts waned.
15th July 2024 10:40
by Myron Jobson from interactive investor
interactive investor (ii), the UK’s second-largest investment platform, has launched a new index to provide insights on how investors are choosing to invest, the regions that are proving popular and those that have fallen out of favour.
Called ii Trading Index, the barometer draws from data on the purchases and sells of investments made by ii’s more than 400,000 customer base.
It offers a gauge of popularity of the four main investment regions: North America, United Kingdom, Europe and Asia - and the six different investment instruments available to ii customers: equities, unit trusts, investment trusts, exchanged-traded products (ETPs), gilts and bonds.
- Invest with ii: SIPP Account | Stocks & Shares ISA | See all Investment Accounts
ii aims to publish statistics and insights through analysis of purchases and sells of investments in the respective categories on a monthly basis.
Key findings for June 2024
Regions
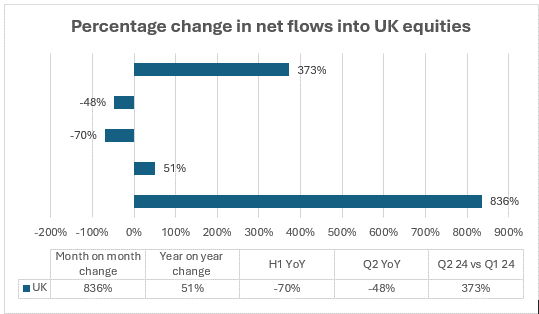
- Appetite for domestic shares has spiked recently, with net inflows into UK listed stockssoaring by 836% in June from May, and jumping by 373% in Q2 2024 from Q1 2024.
- However, net inflows in UK-listed stocks are still below 2023 levels – down 70% in H1 2024 compared to H1 2023 and down 48% in Q2 2024 versus Q2 2023.
- Conversely, net inflows into Asian equities were down 87% in June. The region saw net outflows in Q2 2024, compared to a net inflow in in Q2 2023. Net outflows rose by 54% increase in H1 2024 compared to H1 2023.
- Elsewhere, net inflows into North American equitiesfell 44% month-on-month in June but were up from a net outflow in June 2023. The net inflows total for H1 2024 is down 7% compared to the figure for H1 2023.
- European equities enjoyed net inflows in June following net outflows in May. Net inflows were down 95% in H1 2024 versus H1 2023, and down 65% in Q2 2024 compared to Q2 2023.
Myron Jobson, Senior Personal Finance Analyst, interactive investor, says: “UK equities were the flavour of the month in June, with the UK market buoyed by a number of tailwinds including an improving economy, a revival of M&A activity and a fall in inflation. There might also be an element of private investors betting on a positive outcome for UK plc following the general election, with the newly elected government promising to implement a number of measures to stabilise the UK economy and boost investment to domestic stocks.
“Meanwhile, the tighter than anticipated general election result in India, might have contributed to net outflows in Asian equities. The loss of Prime Minister Narendra Modi’s ruling Bharatiya Janata Party parliamentary majority could have a telling impact on its ability to press ahead with economic reforms. Other developments, such as a scaling back on expectations for US rate cuts are also contributing factors.”
Investment instruments
- The net flow figure for investment trusts was zero in June – down from a significant net inflow a month earlier. The net inflow figure for H1 2024 was 58% lower than H1 2023.
- Q2 proved to be a markedly better period for investment trusts compared to Q1, with net inflows increasing almost ten-fold (971%).
- While net flows into ETPs were down 32% month-on-month in June, the total was up 63% year-on-year in June, up 121% in Q2 2024 versus Q2 2023.
- Net flows into unit trusts also followed a similar pattern – down 37% month-on-month and up 9%, 59% and 74% year-on-year, in H1 2024 versus H1 2023 and in Q2 2024 compared to the same period last year, respectively.
- When it comes to fixed income, net flows into gilts were up 130% in H1 2024 versus H1 2023 and 43% in Q2 2024 versus Q2 2023. However, net flows are down on a month on month (55%).
- Meanwhile, appetite for bonds has waned in recent history, going from net inflows across the given time periods in 2023 to net outflows in 2024.
- It is a mixed bag for equities which saw net inflows in June compared to net outflows in May and June 2023. However, the reverse over H1 and Q2 2024, which both saw net outflows compared to the same period in 2023.
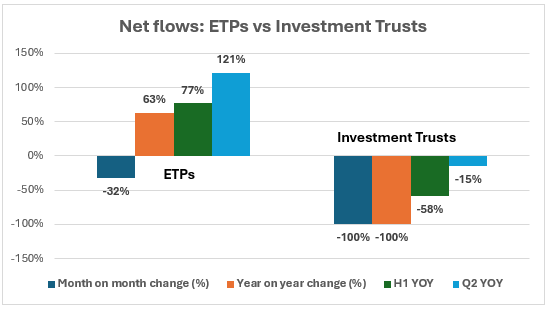
Source: interactive investor. NOTE: Net inflows are minus 100% compared with May 24 and June 2023 because net inflows were zero in June 2024.
Kyle Caldwell, Funds and Investment Education Editor, interactive investor, says: “Investment trusts have been the bedrock of many of our customer portfolios for decades. While in terms of overall flows our data shows there has been a move away from the sector of late, those that are reducing exposure are arguably doing so at the worst possible point as investment trust discounts are collectively at one of their highest ever levels.
“During times of weak sentiment there are always opportunities, and in the case of investment trusts there are certainly no shortage of potential bargains. The ability to potentially buy an investment trust on a discount is one of the bells and whistles that sets trusts apart from funds.”
Most traded investments on ii
Overall, there were more purchases than sells of investments available on interactive investor: 61% buys, 39% sells in June. The buys are up from May (57% buys, 43% sells), and are greater than the average for H1 and Q2 2024 (58% buys, 42% sells, respectively).
The most-traded investments in June are outlined below.
Investments | Instrument Name | Buys | Sells |
EQUITY | 88% | 12% | |
TN26 | GILT | 89% | 11% |
FUND | 65% | 35% | |
GILT | 94% | 6% | |
FUND | 86% | 14% | |
FUND | 81% | 19% | |
FUND | 88% | 12% | |
EQUITY | 73% | 27% | |
FUND | 78% | 22% | |
ETF | 79% | 21% |
Source: interactive investor
Victoria Scholar, Head of Investment, interactive investor, says: “The hunt for yield has been a major theme for investors lately. Trading activity on ii for June suggests that gilts continue to be popular among customers thanks to both the attractive yields on offer as well as the potential for bond prices to rise when the Bank of England finally begins cutting interest rates potentially in August.
“Investors continue to buy Royal London Short Term Money Market Fund, a cash-like investment which yields more than 5% by using bank accounts and short-term bonds. On the equities side, Legal & General shares have been well bid by ii customers in June, thanks to its highly competitive dividend yield of almost 9% which continues to draw significant interest, particularly from the income investor community.
“Investors continued to favour global funds with Vanguard’s LifeStrategy range proving popular, offering easy access to own thousands of shares and bonds from around the world through a single fund. Similarly, the Vanguard S&P 500 UCITS ETF and the HSBC FTSE All World Index provide easy access to the US stock market and global equity market respectively.
“Technology remained popular among ii customers in June with the sector continuing to power portfolios. as hype over. Legal & General Global Technology Index Trust attracted notable demand in June. On the single stock side, investors continued to buy Nvidia in June. The company has become the poster child for the artificial intelligence stock market frenzy and even after a bout of volatility last month, shares are still up by over 150% since the start of 2024.”
Notes to Editors
Region | |||||
Buys | Month on month change | Year on year change | H1 YoY | Q2 YoY | Q2 24 vs Q1 24 |
Asia | -45% | 6% | 1% | 14% | 24% |
Europe | 2% | 43% | 3% | 37% | 15% |
North America | 22% | 94% | 97% | 101% | 4% |
UK | -17% | 31% | 13% | 41% | 15% |
Sells | Month on month change | Year on year change | H1 YoY | Q2 YoY | Q2 24 vs Q1 24 |
Asia | -41% | -6% | 3% | 33% | 21% |
Europe | -1% | 41% | 4% | 40% | 13% |
North America | 29% | 67% | 99% | 81% | -8% |
UK | -26% | 29% | 25% | 54% | 10% |
Net | Month on month change | Year on year change | H1 YoY | Q2 YoY | Q2 24 vs Q1 24 |
Asia | -87% | N/A | N/A | N/A | N/A |
Europe | N/A | -N/A | -95% | -65% | N/A |
North America | -44% | N/A | -7% | N/A | N/A |
UK | 836% | 51% | -70% | -48% | 373% |
Instrument | |||||
Buys | Month on month change | Year on year change | H1 YOY | Q2 YOY | Q2 24 vs Q1 24 |
Equity | -7% | 48% | 25% | 51% | 13% |
Unit trust | -16% | 34% | 64% | 64% | 4% |
ETP | -11% | 48% | 59% | 80% | 7% |
Investment Trust | -20% | 21% | 17% | 32% | 8% |
Gilts | -37% | -30% | 166% | 83% | -19% |
Bonds | -33% | 0% | -19% | 17% | 17% |
Sells | Month on month change | Year on year change | H1 YOY | Q2 YOY | Q2 24 vs Q1 24 |
Equity | -17% | 35% | 35% | 58% | 7% |
Unit trust | -4% | 45% | 66% | 60% | -7% |
ETP | 5% | 42% | 51% | 63% | -3% |
Investment Trust | -4% | 33% | 35% | 43% | -4% |
Gilts | 26% | N/A | 735% | N/A | 11% |
Bonds | -50% | 300% | 233% | 400% | 200% |
Net | Month on month change | Year on year change | H1 YOY | Q2 YOY | Q2 24 vs Q1 24 |
Equity | N/A | N/A | N/A | N/A | N/A |
Unit trust | -37% | 9% | 59% | 74% | 35% |
ETP | -32% | 63% | 77% | 121% | 32% |
Investment Trust | -100% | -100% | -58% | -15% | 971% |
Gilts | -55% | -61% | 130% | 43% | -37% |
Bonds | N/A | N/A | N/A | N/A | N/A |
Percentage change in purchases and sells of investments across equity regions and investment instruments on interactive investor. Source: interactive investor.
N/A denote change from net outflow to net inflow which can’t be calculated on a percentage change basis. Q2 YOY gilt outflow comparison marked N/A as outflow for Q2 2023 was close to zero.
These articles are provided for information purposes only. Occasionally, an opinion about whether to buy or sell a specific investment may be provided by third parties. The content is not intended to be a personal recommendation to buy or sell any financial instrument or product, or to adopt any investment strategy as it is not provided based on an assessment of your investing knowledge and experience, your financial situation or your investment objectives. The value of your investments, and the income derived from them, may go down as well as up. You may not get back all the money that you invest. The investments referred to in this article may not be suitable for all investors, and if in doubt, an investor should seek advice from a qualified investment adviser.
Full performance can be found on the company or index summary page on the interactive investor website. Simply click on the company's or index name highlighted in the article.