ii investment performance review: Q1 2025
The quarter kicked off with the DeepSeek AI shock and ended with Trump’s tariffs plunging markets into turmoil.
11th April 2025 11:50

Market round-up
Tariffs and uncertainty are certainly some popular words used to describe the first quarter of 2025. Investors expected strong US performance to persist or strengthen on prospects of deregulation and lower taxes, however, 2025 has so far played out differently.
- Our Services: SIPP Account | Stocks & Shares ISA | See all Investment Accounts
Optimism faded as investors were subjected to erratic US trade policies which lowered growth expectations and renewed inflation fears, notably with imports from Mexico, Canada and China being slapped with various tariffs. In addition, shifts in US foreign policy failed to yield the swift end to conflicts in Ukraine and Gaza that the US administration had hoped for; but US antagonism over defence has also prompted European policymakers to boost spending on defence, which helped buoy European equities over the quarter.
Amid this chaos we also saw the launch of DeepSeek’s artificial intelligence (AI) model, which is competitive against the more established names from the US, despite being developed using only a fraction of the cost; causing a sell-off in the AI-exposed US mega-cap names as investors questioned their AI strategies. This, however, was short-lived as US tech companies continue to pour money into AI capex, and increasing it in some cases, as they view AI as a long-term strategic investment that goes way beyond cost efficiencies.
2025 has already thrown plenty of obstacles towards investors this year with no let-up in sight. On 2 April 2025, “Liberation Day”, the Trump administration announced widespread tariffs globally with no nation being spared bar Russia, with a base line tariff rate of 10%, which the UK is subject to, threatening already fragile growth. A 20% rate has been levied on the European Union, while China has been subjected to 34% tariffs on top of tariffs already announced.
Global markets sold off sharply in response, with the potential of further fall-out as nations across the globe prepare to respond in spite of the threat of further, reciprocal tariffs by the US; further plunging the global economic machine into the depths of uncertainty.
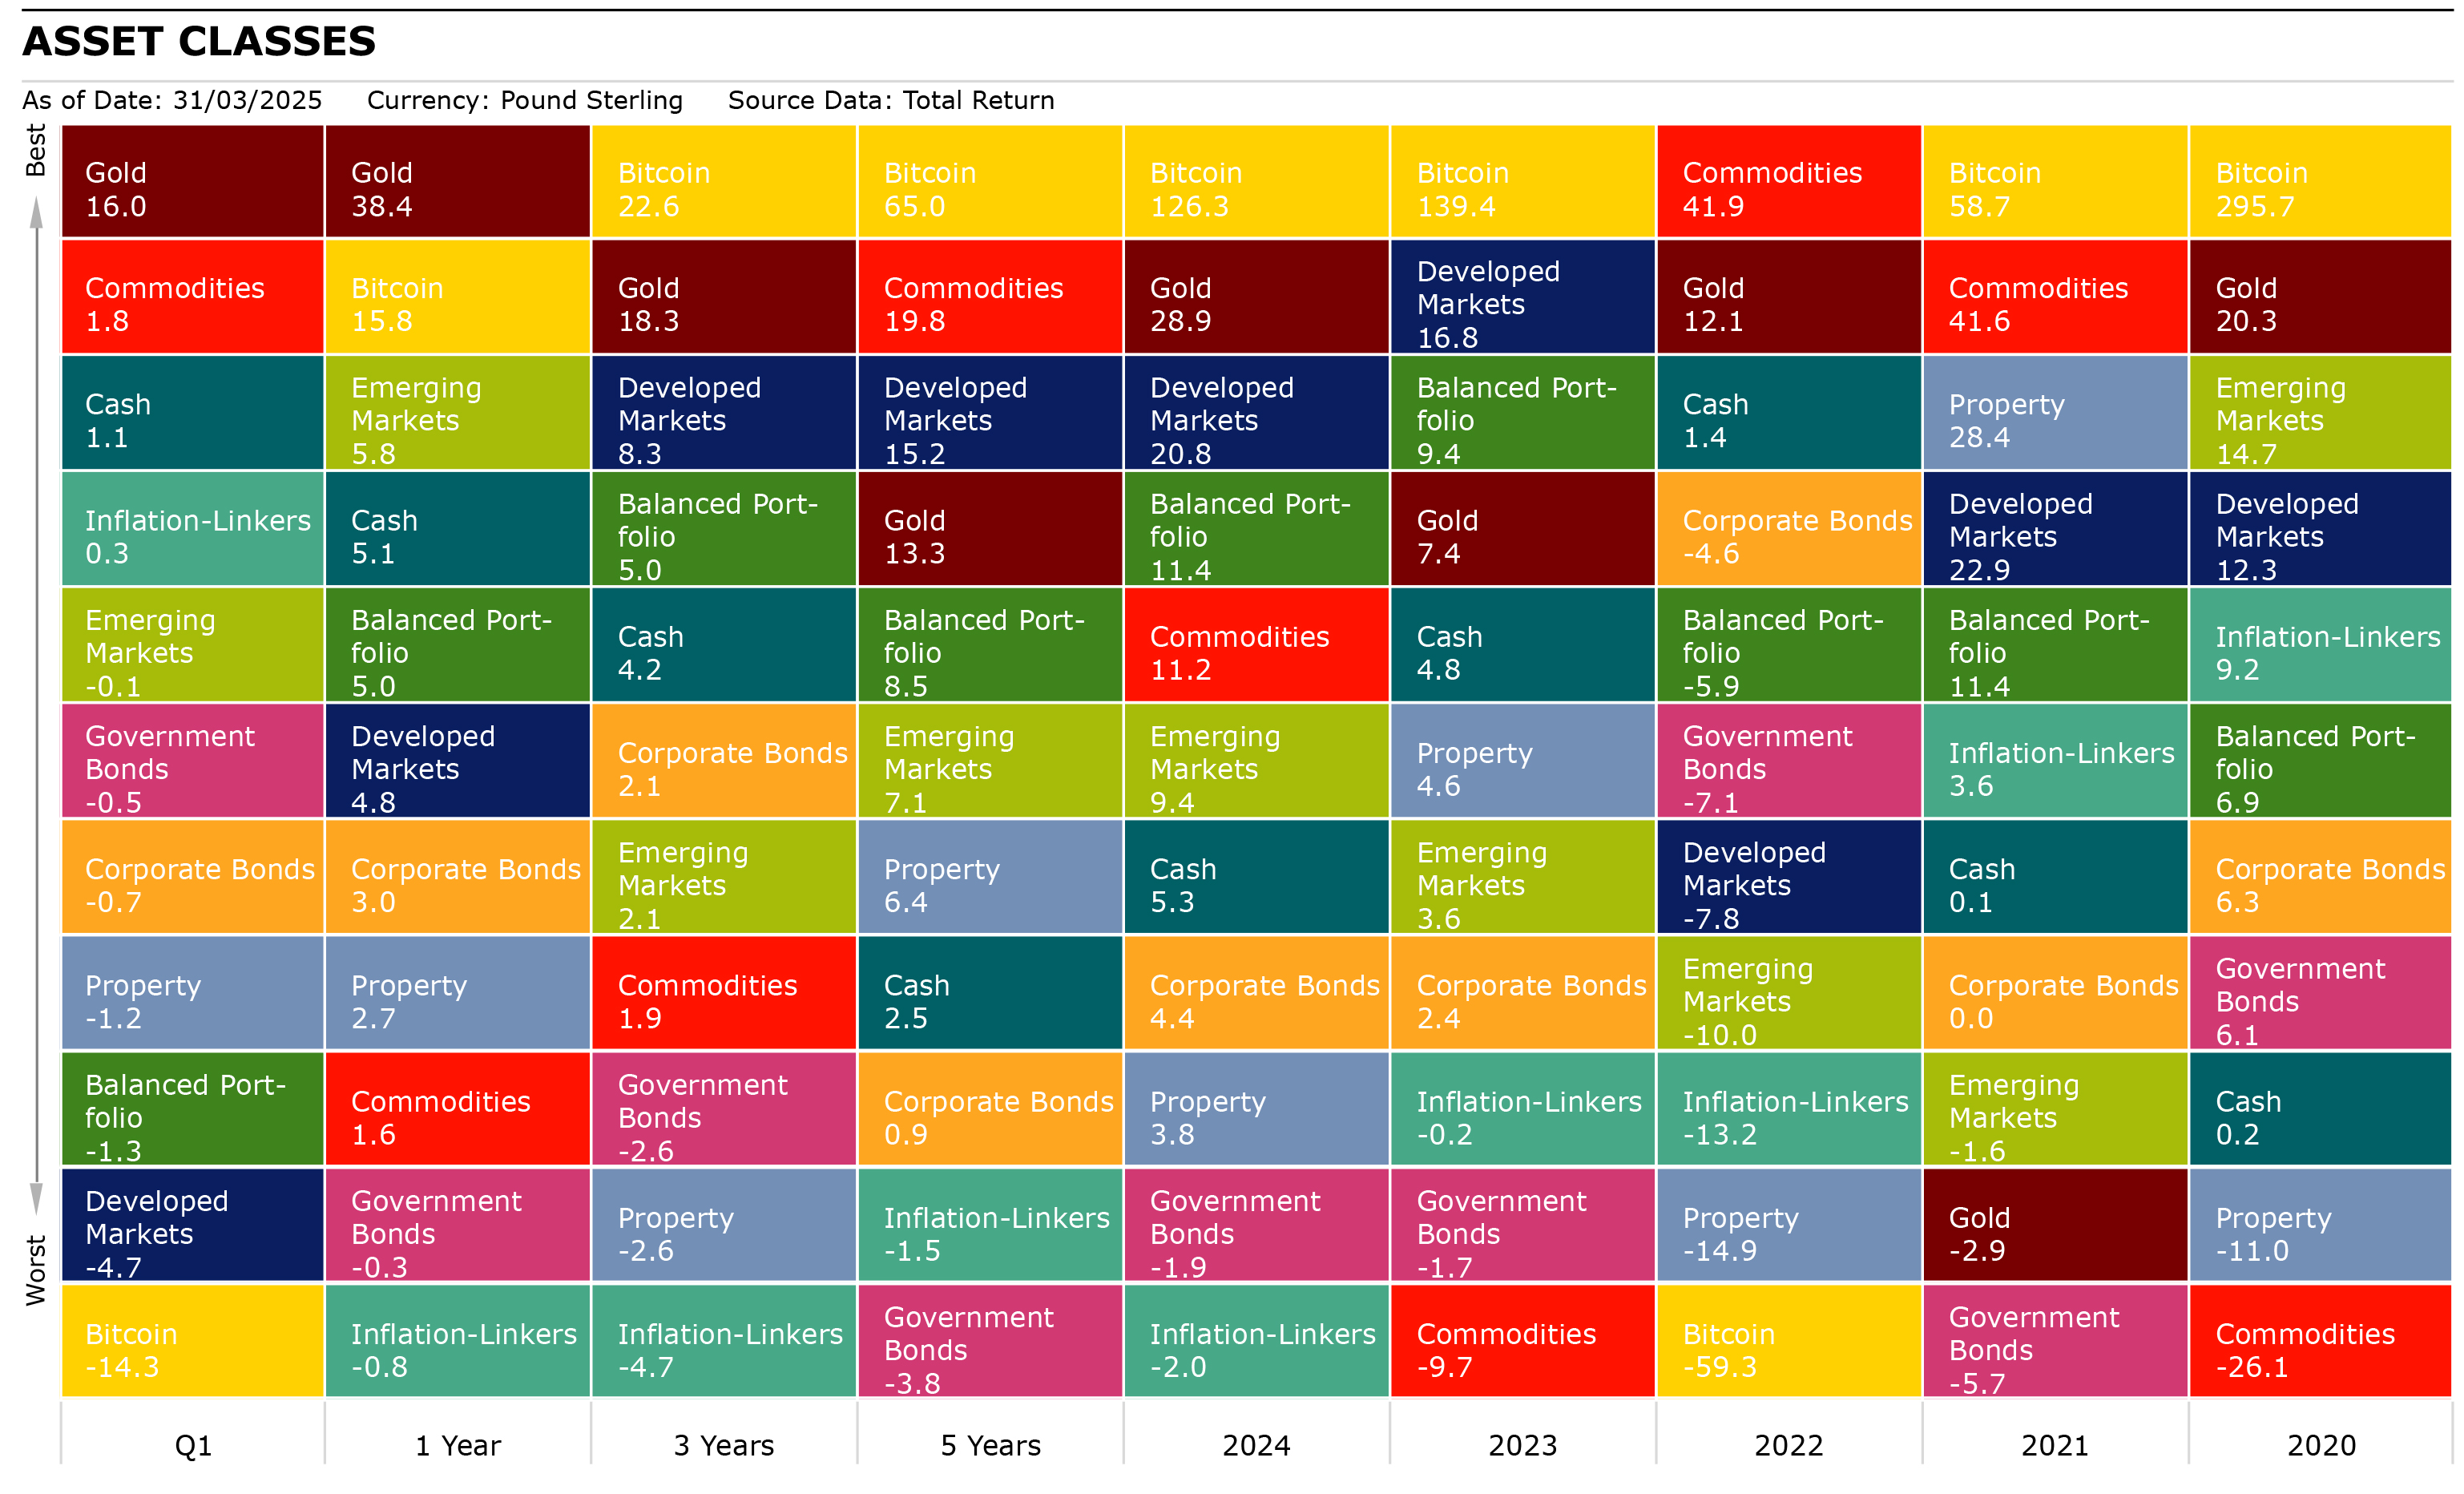
Source: Morningstar as of 31 March 2025. Total Returns in GBP. Developed Markets: MSCI World, Emerging Markets: MSCI EM, Corporate Bonds: Bloomberg Global Aggregate Corporate, Commodities: S&P GSCI, Property: FTSE EPRA Nareit Developed, Inflation-Linkers: Bloomberg Global Inflation Linked, Government Bonds: Bloomberg Global Treasury, Bitcoin: S&P Bitcoin, Balanced Portfolio: FTSE UK Private Investor Balanced, Cash: SONIA Lending Rate, Gold : LBMA Gold Price.
Shares
The MSCI ACWI fell 4.26% in Q1 as Developed Markets (DM) struggled (-4.71%) while Emerging Markets (EMs) closed the quarter flat (-0.13%).
Global market declines can mainly be attributed to US equities as the S&P 500 declined 7.12% over the period on recessionary fears and dampening consumer sentiment brought about by tariffs, and investors questioning the return on AI investment given DeepSeek’s progress. The biggest detractors were consumer discretionary (-16.41%), IT (-15.29%) and communication services (-9.06%). Energy and healthcare were the best-performing sectors having risen 6.67% and 3.24% respectively.
The FTSE All-Share rose 4.51% in Q1 as the UK benefited from the shift in flows out of the US and solid corporate earnings. The market retreated in March due to a deteriorating fiscal outlook with Chancellor Rachel Reeves announcing £8.4 billion of spending cuts, to comply with the government’s own fiscal rules, during the Spring Statement. Investors were spooked by fears of stagflation, which were further exacerbated by fears of significant US tariffs. The best-performing UK sectors were energy (13.67%), telecoms (11.66%), healthcare (8.51%) and financials (8.10%) while basic materials (-7.29%), consumer discretionary (-4.72%) and IT (-4.01%) were the main laggards.
- Sign up to our free newsletter for share, fund and trust ideas, and the latest news and analysis
- Spring Statement 2025: impact on your personal finances
In a reversal from a lacklustre 2024, European equities were a bright spot in Q1 2025 as they rose 7.43% despite the constant threat of US tariffs. European defence stocks were boosted by fears of the US relinquishing its commitment to NATO and the longer-term impact of the Ukraine war on munitions. This tailwind was further strengthened by announcements of increases in defence spending across the Continent and a €500 billion infrastructure package in Germany.
Inflation levels in Europe are at the lowest levels (currently at 2.2%) in the Western world, which has led to two 25bps rate cuts in Q1 from 3.15% to 2.65%, supporting equities. The main contributors to relative outperformance were financials (19.39%), communication services (14.35%), utilities (14.33%), energy (12.82%) and consumer staples (10.44%) as they all saw double-digit returns, while IT (-3.22%) and consumer discretionary (-2.60%) detracted.
In Japan, the Topix fell 1.53% in Q1 with auto & transport equipment (-8.14%) being the largest detractor as Trump slapped a 25% tariff on auto imports, which kicked in on 3 April. Elsewhere, raw materials & chemicals (-5.51%), electronic appliances (-3.85%) and pharmaceuticals (-3.75%) also detracted, while banks (10.06%), real estate (6.89%) and transport & logistics (3.18%) led all sectors in Japan.
EM was flat (-0.13%) for the quarter with its largest constituent, China (11.61%), being a notable performer, despite new tariffs being imposed on it, as fiscal stimulus announcements to support the domestic consumption were well received and increased interest in Chinese tech companies were fuelled by optimism on the emergence of affordable AI technologies.
Numerous emerging European markets such as Poland (27.36%) and the Czech Republic (24.84%) were bright spots for EM due to an improved outlook for the eurozone following Germany’s fiscal policy changes. On the negative side, India (-5.84%) detracted and Taiwan (-15.23%) was the notable detractor from performance as Taiwan Semiconductor Manufacturing Co Ltd ADR (NYSE:TSM) suffered due to DeepSeek’s emergence. This was exacerbated by substantial exposure to US trade policies.
| Q1 | 1 year | 3 years | 5 years | |
| FTSE All-Share | 4.51 | 10.46 | 7.22 | 12.04 |
| FTSE 100 | 6.11 | 11.90 | 8.52 | 12.58 |
| FTSE 250 | -5.03 | 1.10 | 0.41 | 8.10 |
| FTSE Small Cap | -4.18 | 5.85 | 1.41 | 12.34 |
| Europe Ex UK | 7.43 | 2.51 | 7.85 | 12.05 |
| S&P 500 | -7.12 | 5.94 | 9.79 | 17.64 |
| Asia Pacific Ex Japan | -1.88 | 6.79 | 2.20 | 7.29 |
| TOPIX Japan | -1.53 | -2.48 | 6.83 | 8.16 |
| Emerging Markets | -0.13 | 5.79 | 2.12 | 7.08 |
| Brazil | 10.66 | -15.39 | -3.08 | 9.39 |
| China | 11.61 | 37.45 | 4.22 | 0.65 |
| India | -5.84 | -0.41 | 7.65 | 19.55 |
| World | -4.71 | 4.76 | 8.30 | 15.20 |
| MSCI ACWI | -4.26 | 4.87 | 7.62 | 14.26 |
| World Growth | -10.49 | 3.13 | 8.34 | 15.66 |
| World Value | 1.70 | 6.38 | 7.74 | 14.06 |
Source: Morningstar as of 31 March 2025. Total Returns in GBP. MSCI ACWI World Indexes. Past performance is not a guide to future performance.
Sectors/Style
Stylistically, global value outperformed global growth as it rose 1.70% compared to -10.49% in Q1. Given the underperformance of growth stocks, it is not surprising that the largest detractors from global returns at the sector level were IT (-14.27%), consumer discretionary (-10.34%) and communication services (-5.40%) while energy (5.94%), utilities (3.38%) and financials (2.87%) were additive.
At the global market-cap level, companies across the whole spectrum sold off with small caps (-6.83%) suffering more compared to mid (-2.92%) and large caps (-4.50%). There were, however, regional differences as European equities were positive in small (5.33%), mid (8.38%) and large caps (7.33%). In the UK, large caps (6.11%) were positive while mid (-5.03%) and small caps (-4.18%) lagged and Japanese large-cap stocks (-2.74%) suffered relatively against mid (0.88%) and small caps (-0.31%) due to their exporting nature.
| Q1 | 1 year | 3 years | 5 years | |
| Consumer Discretionary | -10.34 | 2.76 | 4.07 | 12.25 |
| Healthcare | 1.83 | -3.03 | 3.02 | 8.58 |
| Industrials | -0.83 | 2.96 | 9.68 | 15.39 |
| Information Technology | -14.27 | 1.55 | 11.23 | 20.10 |
| Materials | 1.64 | -7.52 | -1.79 | 11.81 |
| Utilities | 3.38 | 14.89 | 4.78 | 8.06 |
| Consumer Staples | 2.49 | 4.82 | 3.81 | 7.14 |
| Financials | 2.87 | 18.04 | 12.04 | 18.23 |
| Energy | 5.94 | -0.71 | 9.29 | 20.88 |
| Communication Services | -5.40 | 12.70 | 9.14 | 12.29 |
Source: Morningstar as of 31 March 2025. Total Returns in GBP. MSCI ACWI World Indexes. Past performance is not a guide to future performance.
Fixed income
The Bloomberg Global Aggregate Index (sterling hedged) rose 1.22% this quarter as US Treasury yields fell as investors sought to de-risk due to policy uncertainty leading to recessionary fears amid indications of weaker economic activity. US Treasuries outperformed US corporates and investment grade outperformed high yield. US 2-year Treasury yields fell from 4.25% to 3.91%, while 10-year Treasury yields fell from 4.58% to 4.25% over the quarter.
In the UK, gilts closed the quarter 0.55% up despite a number of headwinds in the form of a deteriorating fiscal outlook, which culminated in budget cuts and fears of stagflation. UK 2-year treasury yields fell from 4.38% to 4.21%, while 10-year yields rose slightly from 4.57% to 4.69%. Sterling corporates underperformed relative to gilts falling 0.68% as spreads widened with inflation-linked gilts also seeing a fall, with a decline of 1.42%.
- Bonds bolster portfolios amid equity collapse
- Benstead on Bonds: in a worst-case scenario, can gilts deliver?
In Europe, government bonds underperformed corporates as yields rose as Germany announced plans to create a €500 billion infrastructure fund and that it will be loosening borrowing rules to boost defence spending. As a result, German bund 10-year yields increased from 2.36% to 2.73%, while 2-year yields saw marginal decrease from 2.07% to 2.03%.
Since the announcement of Trump’s Liberation Day tariffs, which applied globally, yields have fallen across the globe as investors have fled to safe havens over recessionary fears and increasing economic uncertainty, especially over any potential retaliatory actions. All this will no doubt weigh on central bank policy makers over rate cuts as they tread a fine line between controlling inflation and any potential economic fall-out from widespread tariffs.
| Q1 | 1 year | 3 years | 5 years | |
| Global Aggregate | -0.41 | 0.85 | -0.97 | -2.17 |
| Global Government | -0.46 | -0.31 | -2.56 | -3.79 |
| UK Gilts | 0.55 | -1.19 | -6.14 | -5.81 |
| Global Corporate | -0.70 | 2.95 | 2.14 | 0.89 |
| Sterling Corporate | 0.73 | 2.44 | -0.82 | -0.19 |
| EURO Corporate | 1.30 | 2.04 | 0.55 | -0.09 |
| Global Inflation Linked | 0.35 | -0.79 | -4.69 | -1.50 |
| UK Inflation Linked | -1.47 | -8.05 | -14.28 | -7.55 |
| Global High Yield | -1.18 | 6.57 | 6.19 | 6.23 |
Source: Morningstar as of 31 September 2025. Total Returns in GBP. Global Aggregate: Bloomberg Global Aggregate, Global Government: Bloomberg Global Treasury, UK Gilts: FTSE Act UK Conventional Gilts All Stocks. Global Corporate: Bloomberg Global Corporate, Sterling Corporate: ICE BofA Sterling Non-Gilt, Euro Corporate: Markit iBoxx EUR, Global High Yield: Bloomberg Global High Yield, Global Inflation Linked: Bloomberg Global Inflation Linked, UK Inflation Linked: Bloomberg Global Inflation Linked UK. Past performance is not a guide to future performance.
Alternatives
The S&P GSCI rose 1.77% over the quarter with precious metals being the main contributor as investors sought safe-haven assets such as gold, which rose 15.96%. Silver also benefited from this as it increased 14.96%.
The worst-performing commodities sector was agriculture as it declined 4.19% with cocoa seeing a more than 30% fall, while wheat (-6.67%), cotton (-5.79%), corn (-4.79%) and soybeans (-3.09%) also registered negative returns. Coffee was the bright spot in agriculture as it rose 19.27% in the period.
| Q1 | 1 year | 3 years | 5 years | |
| Global REITs | -1.17 | 2.75 | -2.64 | 6.39 |
| UK REITs | 2.01 | -7.67 | -11.33 | 0.30 |
| Gold | 15.96 | 38.36 | 18.27 | 13.31 |
| Global Infrastructure | 1.49 | 16.27 | 6.80 | 12.91 |
| Global Natural Resources | 3.94 | -5.90 | -0.50 | 15.27 |
| Volatility | 24.60 | 67.60 | 3.40 | -16.75 |
| Cash | 1.14 | 5.09 | 4.18 | 2.53 |
| Commodity | 1.77 | 1.61 | 1.93 | 19.78 |
| Brent crude oil | -2.80 | -15.89 | -10.02 | 22.21 |
| Energy | 1.71 | -2.56 | 2.77 | 27.05 |
| Bitcoin | -14.35 | 15.75 | 22.64 | 65.00 |
Source: Morningstar as of 31 March 2025. Total Returns in GBP. Global REITS: FTSE EPRA Nareit Developed, UK REITs: FTSE EPRA Nareit UK, Gold: LBMA Gold Price AM, Oil: Oil Price Brent Crude, Global Infrastructure: S&P Global Infrastructure, Natural Resources: S&P Global Natural Resources, Commodities: S&P GSCI , Energy : S&P GSCI,Volatility: CBOE Market Volatility (VIX), Cash: SONIA Lending Rate, Bitcoin: S&P Bitcoin. Past performance is not a guide to future performance.
Most-traded shares on the ii platform in Q1 2025
Most-bought shares
Most-sold shares
These articles are provided for information purposes only. Occasionally, an opinion about whether to buy or sell a specific investment may be provided by third parties. The content is not intended to be a personal recommendation to buy or sell any financial instrument or product, or to adopt any investment strategy as it is not provided based on an assessment of your investing knowledge and experience, your financial situation or your investment objectives. The value of your investments, and the income derived from them, may go down as well as up. You may not get back all the money that you invest. The investments referred to in this article may not be suitable for all investors, and if in doubt, an investor should seek advice from a qualified investment adviser.
Full performance can be found on the company or index summary page on the interactive investor website. Simply click on the company's or index name highlighted in the article.