How have US trusts fared since Trump won re-election?
An analyst at Kepler Trust Intelligence examines how investment companies have fared since the US election in November.
4th April 2025 14:06

This content is provided by Kepler Trust Intelligence, an investment trust focused website for private and professional investors. Kepler Trust Intelligence is a third-party supplier and not part of interactive investor. It is provided for information only and does not constitute a personal recommendation.
Material produced by Kepler Trust Intelligence should be considered a marketing communication, and is not independent research.
One of George Lucas’ earlier and perhaps lesser-known works is 1973’s American Graffiti. This film stands in stark contrast to the Star Wars and Indiana Jones franchises, as it features none of the epic, superhuman characters or fantastic elements of Lucas’ later works. To boil down the plot to a single sentence, American Graffiti follows various teenagers on their last night before leaving for college in early 1960s California. In short, the story is down to earth and offers nothing in terms of space battleships or adventurous explorations of ancient ruins. After watching this film, it would certainly have been hard to guess that Lucas would later venture into the science fiction and action-adventure genres.
- Invest with ii: Open a Stocks & Shares ISA | Top ISA Funds | ISA Offers & Cashback
Perhaps the same unpredictability can be seen in US equities since the presidential election on 5 November 2024. After Donald Trump’s victory, the dominant expectation was that the new administration’s deregulation and tax cuts agenda would amplify US exceptionalism and widen the gap with the rest of the world. This initial enthusiasm was arguably reflected in the post-election rally (starting on 5 November) of the S&P 500, which peaked on 23 January 2025.
However, it has since then fizzled, giving back all its gains. As such the US has lagged most major equity markets since early November 2024, as the chart below shows. Arguably, this is not an evolution that many had foreseen after the results of the US election were announced.
PERFORMANCE OF INDICES
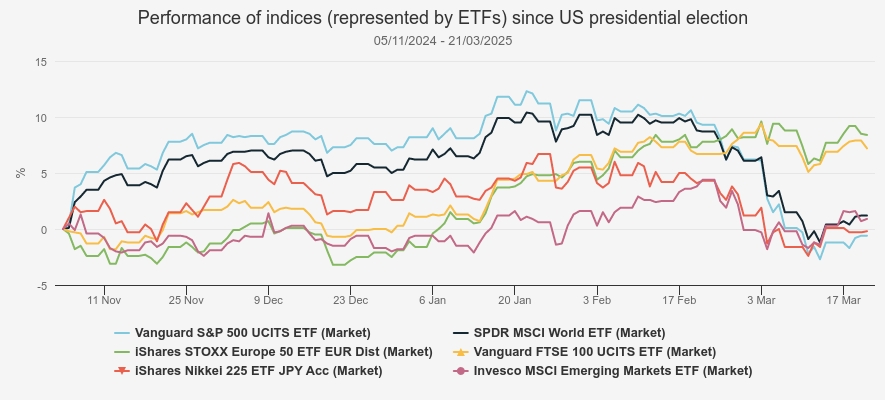
Source: Morningstar. Past performance is not a reliable indicator of future results
Over the period under review, concerns about the potential impacts of tariffs, including potential slower growth and higher inflation, have overshadowed US equities. However, to better understand their underperformance, it is useful to examine the individual performance of the 11 sectors that make up the S&P 500 Index.
As shown in the chart below, the materials sector has been the worst performer over the period. However, it only makes up 2% of the index, meaning its influence on the overall performance of the S&P 500 is limited. In contrast, the underperformance of the information technology sector is far more significant, given that it represents 30.7% of the index (as of 28/02/2025), making it by far the largest sector in the index. In other words, the fortunes of the information technology sector exert a considerable influence on the overall performance of the S&P 500 Index. In our view, there are more than macroeconomic concerns behind the weak performance of the information technology sector. After a two-year AI rally, arguably sparked by the launch of ChatGPT-3.5 in late-2022, questions about the valuation of tech stocks were already being raised before the election. For example, the managers of BlackRock American Income Trust Ord (LSE:BRAI)expressed concerns about valuations of the so-called Magnificent Sevenin the autumn of last year, while the management team of JPMorgan American Ord (LSE:JAM) reduced their positions in those stocks throughout 2024.
Another factor that may have weighed on the US information technology sector is the launch of China’s DeepSeek on 20 January 2025. The company's low development costs have raised questions about the large capital expenditures of major US tech firms on AI projects and the quantity of graphic processing units required. However, we note that DeepSeek’s development costs may be higher than what the company has disclosed, and we think it may be too early to assess whether the emergence of DeepSeek will have a long-term impact. It is also important to remember that the S&P 500’s information technology sector encompasses more than just AI-related companies.
On the other side of the spectrum, financials has been the best-performing sector over the period, particularly bank stocks. As in other regions, the higher interest rate environment has been favourable for banks, as it has allowed them to capitalise on the wider spread between the interest they charge on loans and the interest they pay on deposits. In addition, some US regional banks have benefitted from broader trends in the country, such as the construction of data centres, leading to population growth. This is the case in the Buffalo area (New York) to which the managers of JAM have been exposed through M&T Bank, which operates in this region. Meanwhile, the deregulation agenda of the Trump administration could provide a tailwind for American banks, enabling them to use their surplus capital to reward shareholders. This is one of the reasons why Nish Patel, manager of The Global Smaller Companies Trust Ord (LSE:GSCT), has been adding US banks to his portfolio over the past 12 months.
US insurers have also performed strongly over the period. Similar to banks, insurers benefit from higher interest rates, as they tend to hold fixed-income securities that offer higher yields, allowing them to earn greater returns on their portfolios. Moreover, higher rates reduce the present value of their future liabilities, thereby improving their financial stability. This is an industry that the managers of BRAI find attractive, with stable businesses trading at attractive valuations.
S&P 500 SECTORS
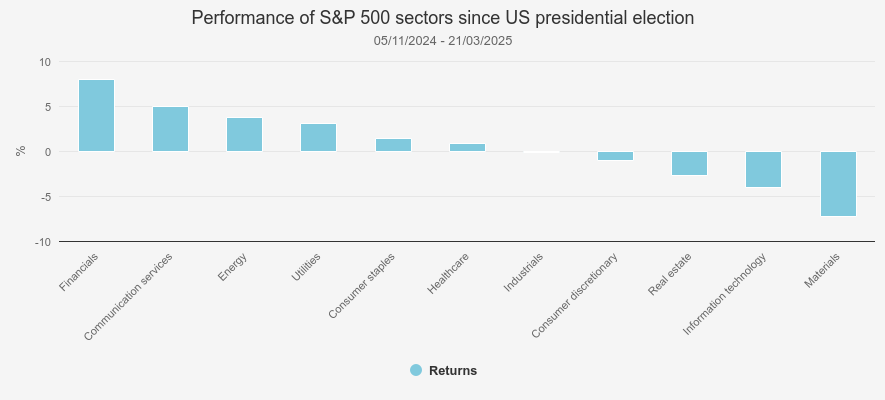
Source: Morningstar. Past performance is not a reliable indicator of future results
After financials, communication services, energy, and utilities were the next best-performing sectors of the S&P 500 Index. With the exception of communication services, these sectors are arguably considered more value oriented, and indeed, value stocks have outperformed their growth counterparts in the US during the period under review. Between 05 November 2024 and 21 March 2025, the Russell 1000 Value Index returned 1.5% compared to -0.5% for the Russell 1000 Growth Index.
Should this trend continue, value-focussed strategies in the AIC North America sector should thrive. An example is BRAI. The investment trust has recently proposed adopting a new strategy but has committed to retaining its value-oriented focus. If approved, BRAI would implement a Systematic Active Equity Investment process, aimed at delivering consistent outperformance of the Russell 1000 Value Index, while managing risk and controlling costs. We understand that portfolios run by BlackRock under a similar approach, the Systematic Active Large Cap Value strategy, have historically outperformed the Russell 1000 Value Index on average. Furthermore, BRAI is proposing to enhance its dividend policy by offering an equity income option in a traditionally low-yielding market. We also note that North American Income Trust Ord (LSE:NAIT)shares a similar tilt toward value stocks (see chart below) and also has an income mandate, and both BRAI and NAIT have outperformed the S&P 500 and the Russell 1000 Value indices during the period under review.
FACTOR EXPOSURE*
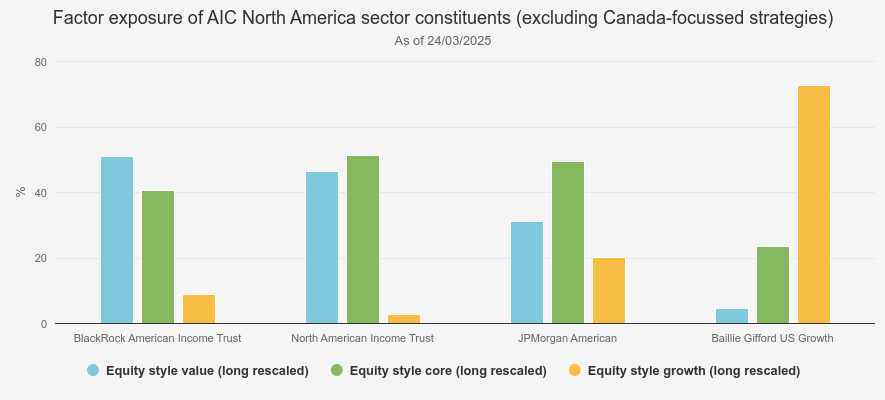
Source: Morningstar *Data unavailable for Pershing Square Holdings (PSH)
JAM has also rotated into ‘old world’ sectors after trimming its positions in tech stocks. The managers believe these sectors will benefit from the strength of the US economy. However, JAM is a core strategy, and while the managers may tilt the portfolio towards either growth or value, they are likely to maintain a balanced exposure across factors. As such, JAM is likely to adapt to different environments, regardless of which factor is in favour, and may suit investors preferring less stylistic strategies.
Despite the outperformance of value relative to growth, Baillie Gifford US Growth Ord (LSE:USA) has been the best-performing investment company in the AIC North America sector (excluding the two Canada-focused strategies) since the US election, as shown in the chart below. This is perhaps surprising, given that USA has the largest allocation to growth stocks among the peer group. However, USA has benefitted significantly from the revaluation of SpaceX in December 2024, with the shares of Elon Musk’s unlisted company appreciating c. 65% in value. After this revaluation, SpaceX made up just over 11% of USA’s portfolio as of the end of February. It's worth noting that USA’s allocation to private assets stands at c. 33% (as of 31/01/2025). Private assets are not valued as frequently as publicly listed equities and thus tend to behave differently.
PERFORMANCE SINCE US ELECTION
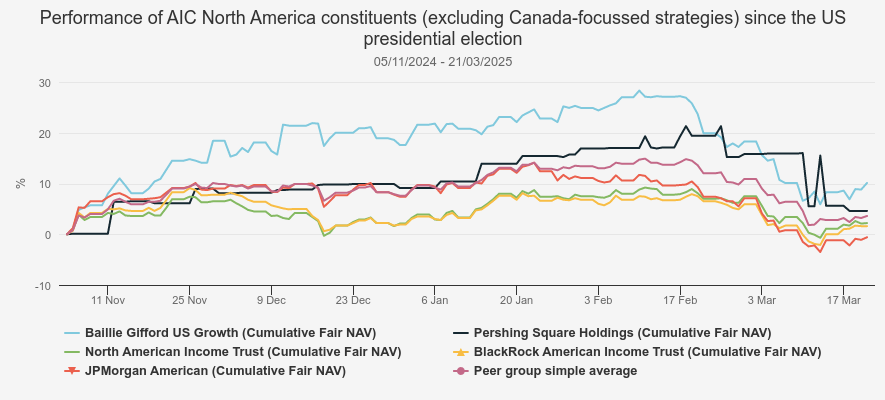
Source: Morningstar. Past performance is not a reliable indicator of future results
Pershing Square Holdings Ord (LSE:PSH)was the second-best performer among the US-focused strategies. PSH is another highly differentiated strategy, holding only 14 stocks (as of 28/02/2025) chosen for their ability to generate predictable and growing free cash flows, for operating in industries with strong barriers to entry, and trading at a discount to intrinsic value.
The manager, Bill Ackman, also engages with investee companies to encourage improvements and employs derivative strategies, notably to hedge the portfolio against market sell-offs. As such, PSH is arguably a more idiosyncratic strategy and is likely to behave differently from US equity indices.
Small-caps stuck in the slow lane
Small-cap stocks rallied after the US election, with the Russell 2000 Index outperforming the S&P 500 Index in the weeks immediately following 05/11/2024. This enthusiasm was arguably fuelled by expectations that smaller companies would benefit from Donald Trump’s corporate tax cuts and possibly from tariffs, as American consumers might have been incentivised to shift their demand toward domestic producers if foreign-made goods became more expensive.
However, this rally fizzled by mid-December 2024, and the Russell 2000 Index has underperformed US large-caps between 05/11/2024 and 21/03/2025, as shown in the chart below. That said, we note that Brown Advisory US Smaller Companies Ord (LSE:BASC), one of the two constituents of the AIC North American Smaller Companies sector, has fallen less than the benchmark. This may be due to its emphasis on companies demonstrating strong quality characteristics. We would also highlight that BASC has had relatively low downside capture ratios over five and three years (Brown Advisory began managing the trust in April 2021), meaning it has generally declined less than the Russell 2000 Index in down markets. This observation also applies to JPMorgan US Smaller Companies Ord (LSE:JUSC), although it has underperformed its benchmark since the US election.
PERFORMANCE SINCE US PRESIDENTIAL ELECTION
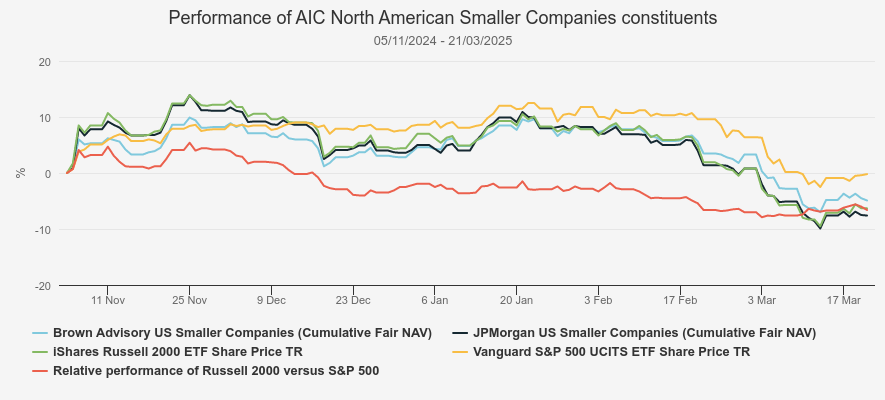
Source: Morningstar. Past performance is not a reliable indicator of future results
The underperformance of US smaller companies relative to their large-cap peers may be due to their greater sensitivity to market sentiment. As smaller companies tend to be less liquid and have lower trading volumes, they can experience larger price swings—upward when market sentiment is positive and downward when it is negative. Moreover, smaller companies are often more exposed to the domestic economy, meaning that concerns about a potential recession in the US may have weighed on sentiment towards this asset class. For instance, the Conference Board Consumer Confidence Index declined for a fourth consecutive month in March 2025, dropping to 92.9. Since consumer spending drives a large portion of economic activity, reduced confidence and spending could accelerate economic contraction. Moreover, the ISM manufacturing purchasing managers' index dropped to 50.3 in February, with a reading below 50 often seen as a signal that businesses are cutting back on production due to weaker demand.
However, US economic indicators are not all pointing toward an imminent recession, which means that the sell-off in small-caps could be an opportunity. For example, the Federal Reserve still expects US GDP to grow 1.7%, although it is a downward revision from its previous forecast of 2.1%. Meanwhile, unemployment remains low, at 4.1% as of February 2025. Finally, the US yield curve is not inverted, with the two-year Treasury yield at c. 4.0% and the 10-year Treasury yield at c. 4.3%. An inverted yield curve is often considered a sign of an impending recession, reflecting expectations that short-term conditions will become more challenging.
However, should a recession occur, we think it is worth remembering that small-caps have historically outperformed large-caps during recovery phases. For example, in the year following the end of the Great Recession (June 2009), the Russell 2000 Index outperformed the S&P 500 Index. The same pattern was observed in the year following the Covid-19 recession, which ended in April 2020, as shown in the chart below.
POST-RECESSION PERFORMANCE
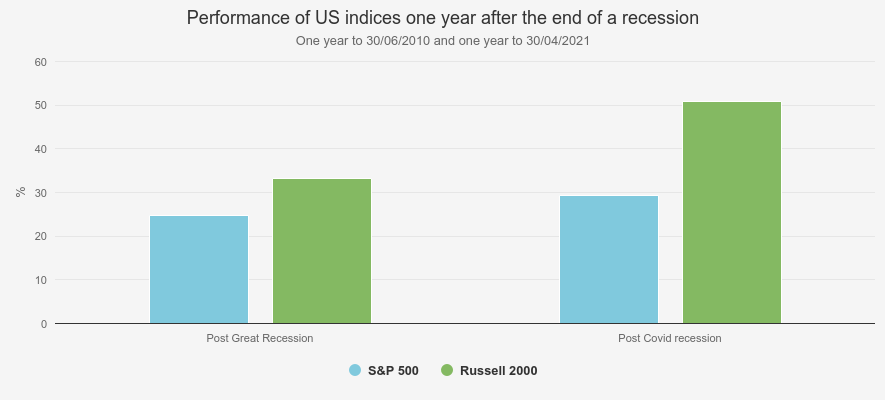
Source: Morningstar. Past performance is not a reliable indicator of future results
To invest in smaller companies, we believe investors are better served by investment trusts, thanks to their closed-end structure. This is because it removes liquidity constraints for managers, allowing them to avoid selling holdings to meet redemption requests. Moreover, the two options in the sector are trading discounts, BASC at 11.5% and JUSC at 6.5%, offering additional upside potential. Over the past five years (to 21/03/2025), JUSC has delivered NAV total returns just slightly behind those of the Russell 2000 Index, but with less volatility than its benchmark. BASC has also lagged the Russell 2000 Index over the past five years, though it has only been managed by Brown Advisory since April 2021, as previously mentioned. It has notably struggled in terms of relative performance over the past 12 months, largely due to the strong returns generated by the financials sector, where BASC is significantly underweight.
FIVE-YEAR PERFORMANCE
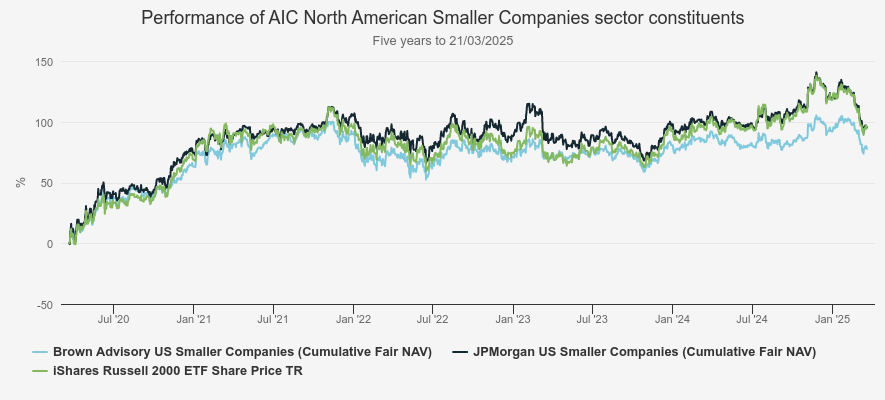
Source: Morningstar. Past performance is not a reliable indicator of future results
Rolling credits
American Graffiti ends with a text epilogue revealing what the main characters would become as adults, and in some cases, their future trajectories were not necessarily apparent from their teenage selves. Similarly, we do not believe that the recent performance of US equities tells us much about their future, and we would caution against drawing too many conclusions from what has been a short period. Forecasting overall market or economic moves is notoriously difficult, and while the outlook for US equities has deteriorated, American exceptionalism may still reassert itself further down the line. For instance, the S&P 500 has lagged global, UK, Europe ex-UK, Japanese and emerging markets in three calendar years since 2016. However, they have resumed their outperformance each time in the following year, as the chart below shows.
CALENDAR-YEAR PERFORMANCE
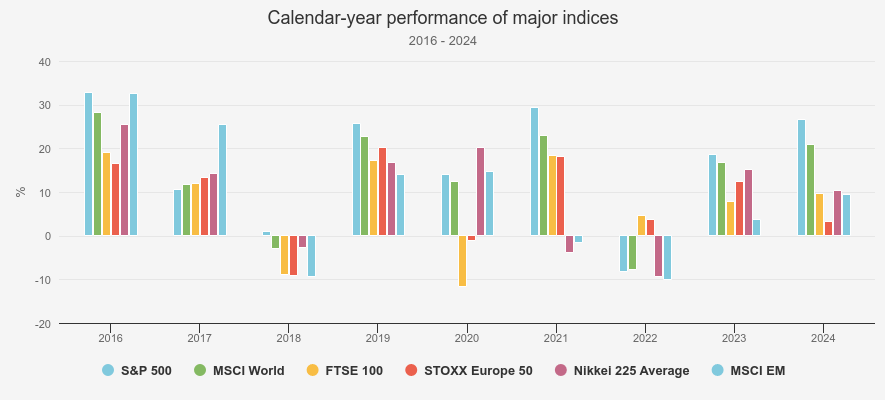
Source: Morningstar
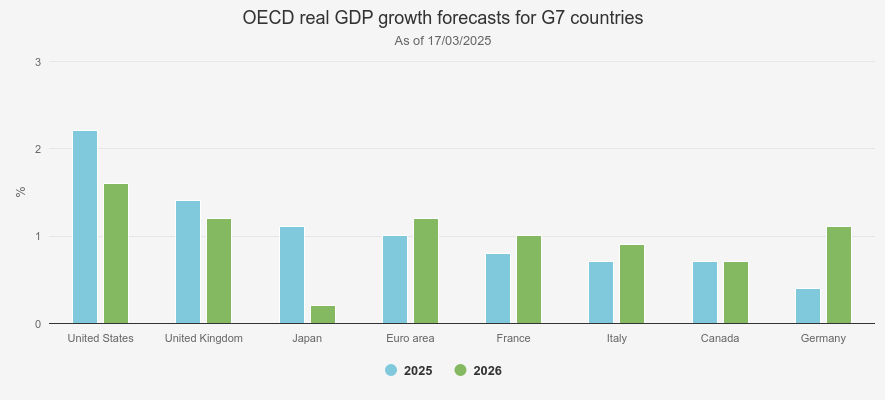
While the US economy has lost some of its lustre in recent months, its prospects remain more favourable than those of other advanced economies. As the chart below shows, the OECD expects US GDP to grow faster than those of other G7 countries both this year and the next, offering a positive backdrop for US equities relative to other developed markets. Moreover, Donald Trump declared that there would be ‘flexibility’ on the tariffs set to be announced on 02/04/2025, suggesting they might not be as severe as initially expected. In addition, the Federal Reserve is expected to cut interest rates twice this year. In our view, these factors could act as catalysts to reignite investor confidence in US equities.
GDP GROWTH FORECASTS
Source: OECD. Past performance is not a reliable indicator of future results
Looking at the discounts in the investment trust sector, JAM is currently the narrowest, at just 3.3% at the time of writing. We think this reflects the strong performance and the appeal of a portfolio with both growth and value elements in an environment where style is hard to call. While we like JAM as a long-term core holding, this does mean, of course, that you could argue there is less value in the shares. BRAI trades on a discount of around 8.9% at the time of writing. As well as a new investment strategy, the board has proposed a tender offer for up to 20% of the shares to be voted on at the general meeting in April. They also plan to offer 100% tenders each three years if performance of the new strategy is not ahead of target. These measures take out some of the risk of the discount widening, and the performance-conditional tender offers add to the attractions of the new strategy. We urge shareholders in the trust to take a view and vote in the upcoming meetings.
There is arguably more value in USA and NAIT, both of which sit at discounts wider than 10%. NAIT’s discount has come in steadily over the past year, and this may reflect a growing interest in value strategies. We think this discount could narrow further if the rotation out of large-cap tech continues. USA, on the other hand, has seen its discount widen after Saba’s proposals were rejected in early February. Saba remains a shareholder, which means we think further actions are likely. This could mean agitating for tenders or continuation votes, and may provide ways to realise the value in the discount. We think the holding in SpaceX is a particularly attractive feature of the trust, although it is true that USA is also heavily exposed to the growth factor, and this will be an important driver of returns. PSH offers another strategy highly exposed to the growth factor, and sits on a much wider discount of 30.5%. However, this is a much more idiosyncratic strategy and with the manager having a very significant shareholding and current information on the portfolio being limited, we think the discount should likely remain wider than those of the other trusts over time.
DISCOUNT
| Investment company | Current discount (as of 21/03/2025) (%) | Five-year average discount (to 21/03/2025) (%) |
| JPMorgan American | 3.3 | 3.1 |
| BlackRock American Income Trust | 8.9 | 6.4 |
| North American Income Trust | 10.9 | 10.1 |
| Baillie Gifford US Growth | 12.1 | 7.5 |
| Pershing Square Holdings | 30.5 | 30.3 |
| Peer group’s simple average | 14.9 | 14.5 |
Source: Morningstar, as of 21/03/2025
Overall, we think the investment trust sector offers a number of very different strategies and a few ways to blend growth and value approaches to the single most important market in the world, either through JAM, which does that all itself, or through allocations to the other individual trusts in the sector.
Kepler Partners is a third-party supplier and not part of interactive investor. Neither Kepler Partners or interactive investor will be responsible for any losses that may be incurred as a result of a trading idea.
These articles are provided for information purposes only. Occasionally, an opinion about whether to buy or sell a specific investment may be provided by third parties. The content is not intended to be a personal recommendation to buy or sell any financial instrument or product, or to adopt any investment strategy as it is not provided based on an assessment of your investing knowledge and experience, your financial situation or your investment objectives. The value of your investments, and the income derived from them, may go down as well as up. You may not get back all the money that you invest. The investments referred to in this article may not be suitable for all investors, and if in doubt, an investor should seek advice from a qualified investment adviser.
Full performance can be found on the company or index summary page on the interactive investor website. Simply click on the company's or index name highlighted in the article.
Important Information
Kepler Partners is not authorised to make recommendations to Retail Clients. This report is based on factual information only, and is solely for information purposes only and any views contained in it must not be construed as investment or tax advice or a recommendation to buy, sell or take any action in relation to any investment.
This report has been issued by Kepler Partners LLP solely for information purposes only and the views contained in it must not be construed as investment or tax advice or a recommendation to buy, sell or take any action in relation to any investment. If you are unclear about any of the information on this website or its suitability for you, please contact your financial or tax adviser, or an independent financial or tax adviser before making any investment or financial decisions.
The information provided on this website is not intended for distribution to, or use by, any person or entity in any jurisdiction or country where such distribution or use would be contrary to law or regulation or which would subject Kepler Partners LLP to any registration requirement within such jurisdiction or country. Persons who access this information are required to inform themselves and to comply with any such restrictions. In particular, this website is exclusively for non-US Persons. The information in this website is not for distribution to and does not constitute an offer to sell or the solicitation of any offer to buy any securities in the United States of America to or for the benefit of US Persons.
This is a marketing document, should be considered non-independent research and is subject to the rules in COBS 12.3 relating to such research. It has not been prepared in accordance with legal requirements designed to promote the independence of investment research.
No representation or warranty, express or implied, is given by any person as to the accuracy or completeness of the information and no responsibility or liability is accepted for the accuracy or sufficiency of any of the information, for any errors, omissions or misstatements, negligent or otherwise. Any views and opinions, whilst given in good faith, are subject to change without notice.
This is not an official confirmation of terms and is not to be taken as advice to take any action in relation to any investment mentioned herein. Any prices or quotations contained herein are indicative only.
Kepler Partners LLP (including its partners, employees and representatives) or a connected person may have positions in or options on the securities detailed in this report, and may buy, sell or offer to purchase or sell such securities from time to time, but will at all times be subject to restrictions imposed by the firm's internal rules. A copy of the firm's conflict of interest policy is available on request.
Past performance is not necessarily a guide to the future. The value of investments can fall as well as rise and you may get back less than you invested when you decide to sell your investments. It is strongly recommended that Independent financial advice should be taken before entering into any financial transaction.
PLEASE SEE ALSO OUR TERMS AND CONDITIONS
Kepler Partners LLP is a limited liability partnership registered in England and Wales at 9/10 Savile Row, London W1S 3PF with registered number OC334771.
Kepler Partners LLP is authorised and regulated by the Financial Conduct Authority.