The hidden costs of passive investing
Kepler's Thomas McMahon considers the effect of passive investing on markets and why active management can be a good choice even in a supposedly efficient market such as US mega-caps.
21st February 2025 13:57

This content is provided by Kepler Trust Intelligence, an investment trust focused website for private and professional investors. Kepler Trust Intelligence is a third-party supplier and not part of interactive investor. It is provided for information only and does not constitute a personal recommendation.
Material produced by Kepler Trust Intelligence should be considered a marketing communication, and is not independent research.
Investing is so challenging – and so interesting – because markets are constantly changing. One of the most important changes in the structure of stock markets over the past two decades is the rise of passive investing.
Let’s state up front that we don’t propose to replay the tedious active/passive debate. The correct opinions are: there are lots of good things about index trackers, ETFs and low-cost passive investing, but academic arguments that active cannot outperform are bogus.
What we are interested in here is the effect of passive investing on markets, which is something both active and passive strategies have to deal with. Indeed, there is a good argument that beyond a certain tipping point, passive investing might make active investing more lucrative, if not easier. And passive investing might actually become less attractive over time as it becomes more successful.
- Invest with ii: SIPP Account | Stocks & Shares ISA | See all Investment Accounts
What is the problem?
The basic idea behind passive investing is that it is not worth trying to beat the market, because the market efficiently absorbs all available information into the best possible estimation of value. It can only do this, of course, if other investors are reacting to information and trying to estimate value. This means passive investing is essentially predatory on active investors. If there were only passive investors in a market, then the theoretical argument for passive would make no sense – if nobody is incorporating information in their stock trading decisions, then the market doesn’t reflect all publicly available information.
Clearly, we aren’t in that extreme situation, but the rise of passive has been relentless. Passives now take the majority of new flows into funds in the US, UK and Europe. And at the very end of 2023, passives made up more than half the total assets held in US mutual funds for the first time. It is reasonable to wonder what effect this might have on market behaviour. Passive investors typically invest via regular deposits at predetermined dates. This means that if ‘news’ happens, they won’t buy or sell. Only a shrinking cohort of active investors will, and they will have to buy or sell from each other. This, it is argued, means that either very bad or very good news should see the price move further and faster as there won’t be the liquidity to satisfy all those trying to buy or sell.
It's a neat idea that makes a lot of sense theoretically, but do we find any evidence of it? There have certainly been some remarkable examples of single stocks moving extreme amounts on single days in recent months. NVIDIA Corp (NASDAQ:NVDA), for example, lost 17% on the day that Chinese AI firm DeepSeek claimed to have produced an LLM with a fraction of the computing power it was thought necessary.
Novo Nordisk AS ADR (NYSE:NVO) lost 27% on the day that it reported results for its new weight-loss drug that disappointed the market. Notably, these are some of the very largest stocks in their markets; Nvidia the second-largest stock in the world before its massive one-day drop, and Novo Nordisk the largest European-listed company.
Theoretically, it should be the smaller companies that would be most liable to big one-day moves because of their poorer liquidity, not the mega-caps. So, do these moves imply the sort of liquidity needed for well ordered large-cap markets isn’t there? Is it evidence that passives have distorted markets, pushed up valuations and led to volatility around events? If so, then the opportunity for active investors to get single-stock picks right seems to be better than it has been for years.
What is the evidence?
Two data points don’t demonstrate a trend, however. There is some statistical evidence of a general uptick in volatility around earnings calls in recent months, which is promising. According to Dow Jones Market Data (cited by MarketWatch) the average post-earnings move for S&P 500 index companies was 4.6% for Q4 2024 (in either direction), which compares to a five-year average of 4%.
A notable feature was that the largest stocks in the index (those above $500 billion in market cap) saw elevated volatility as well as the smallest (those with $5 billion to $10 billion in market cap). Interestingly, the 10-year average was marginally lower at 3.7%. This is a relatively short time frame though, and needs to be put in a longer-term context.
The chart below shows the three-month rolling standard deviation of the daily returns of Apple Inc (NASDAQ:AAPL), Microsoft Corp (NASDAQ:MSFT) and Amazon.com Inc (NASDAQ:AMZN) over the past 10 years, along with that of the S&P 500 index. If our thesis is right, there should be evidence that the single-stock volatility of these mega-caps has risen.
A trend line shows a very modest increase over time for the underlying series, but eyeballing the chart shows this is largely due to very low volatility in 2017 and high volatility in 2022 and early 2023, with obvious macro causes. There is also a more modest uptick in volatility at the end of last year. In our view, this data does not suggest any significant, steady rise in volatility over the years.
VOLATILITY OF LEADING STOCKS
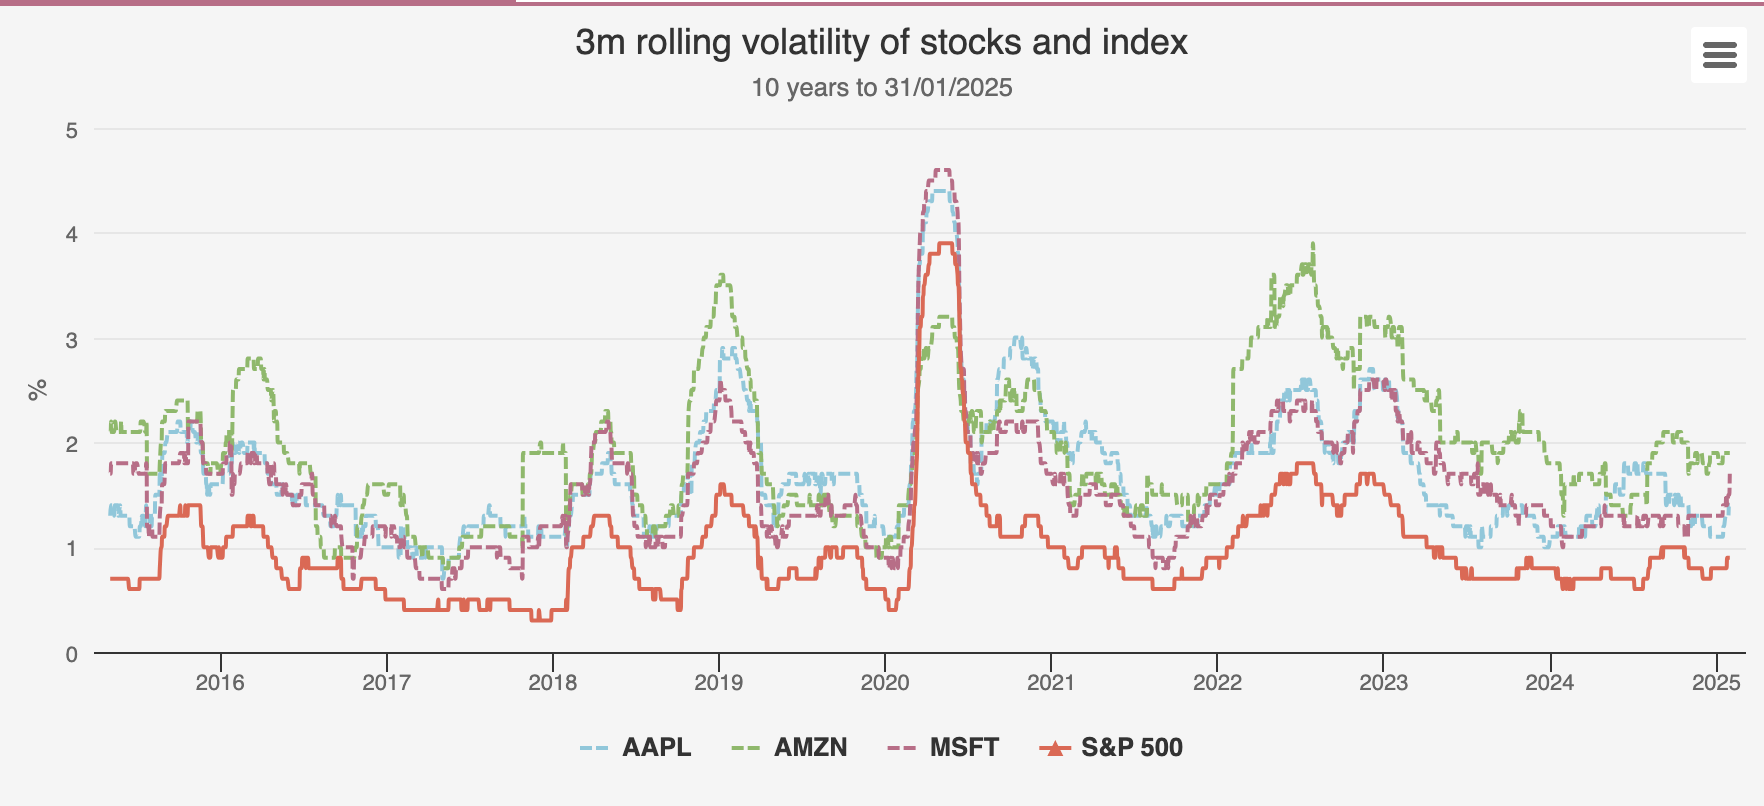
Source: yfinance. Past performance is not a reliable indicator of future results.
If the thesis is correct, then we think we should expect to see a difference in the trends for the individual stocks and the index. If earnings and other news have a greater effect on individual stocks, their share prices should be more volatile. However, in an index of 500 stocks, the magic of diversification should mean that this has little impact on the index’ volatility, as earnings are specific to single companies. In other words, the patterns should diverge.
In our view, the chart for the S&P 500 index shows a remarkable similarity to that of Apple and Microsoft, and a very similar pattern to Amazon. There is a notable rise in volatility in 2020 and in 2022, and a more recent, modest bump. We don’t think there is any evidence here that stocks are becoming less correlated around news.
Is it possible that we are looking at the wrong metric though? Could it be that active investors are more sensitive to bad news, and so we should be looking at downside moves only? The chart below shows the minimum daily return on a three-month rolling basis for the same stocks and index. In other words, this is the greatest one-day loss over a three-month period.
Again, we think there is no evidence of decreasing correlation between single stocks and index. Amazon does seem to show the most amount of independence in returns, as it does in the chart above, but there is no obvious trend towards greater losses or greater variability from the index. In all cases, the panic in 2020 is visible, and then a second drawdown in 2022. We also see the elevated volatility coming through in Q4 2024.
MAXIMUM LOSS OF STOCKS AND INDEX
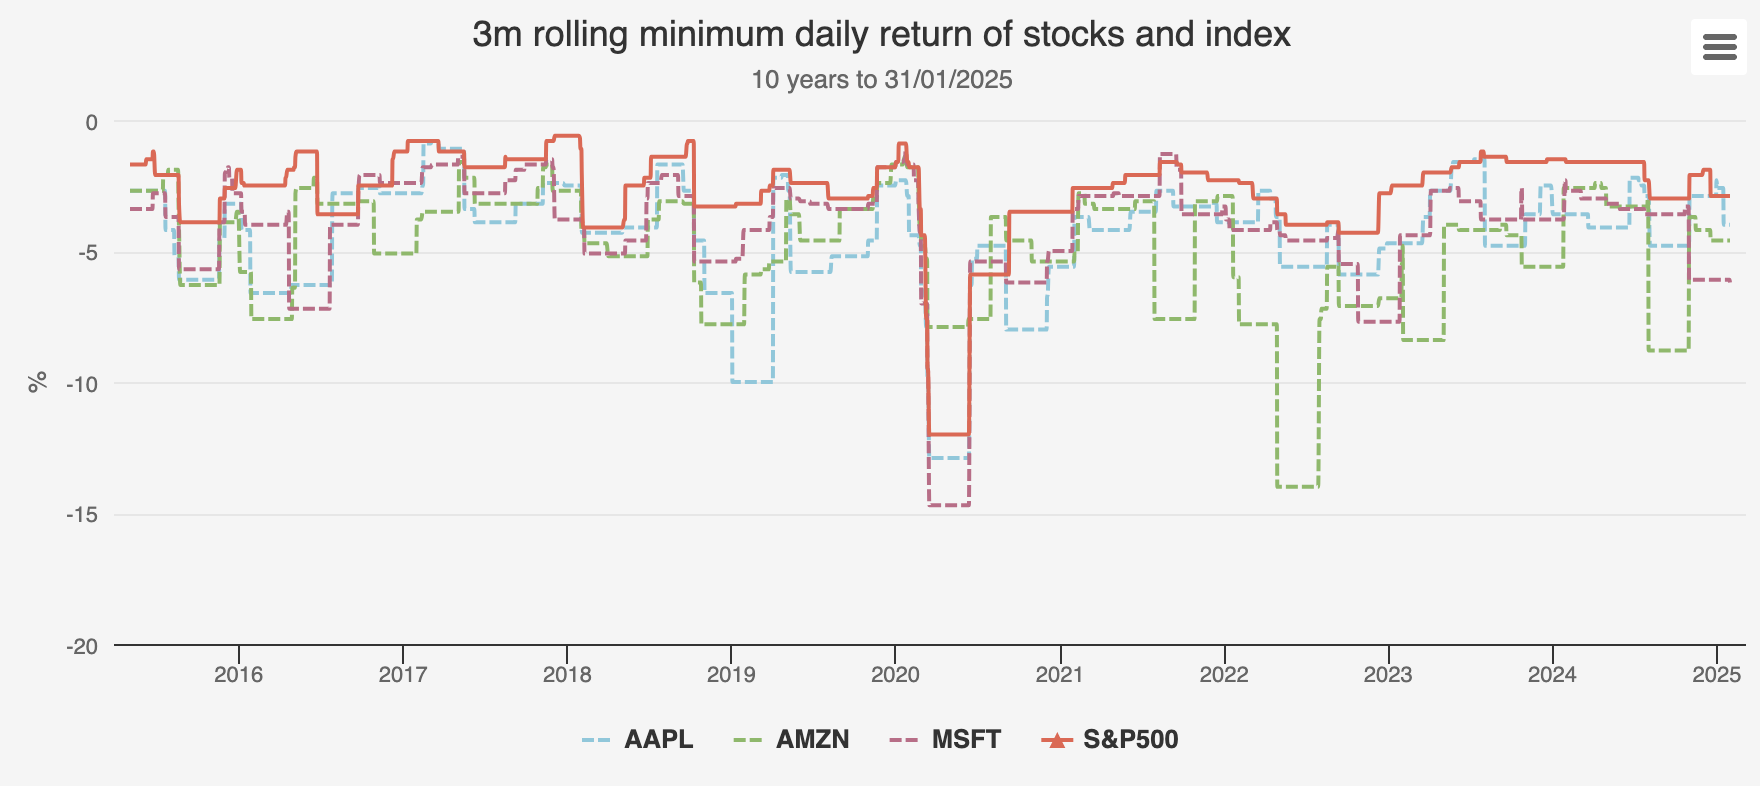
Source: yfinance. Past performance is not a reliable indicator of future results
What is driving recent volatility?
None of this data is conclusive, but we certainly don’t think it supports the idea that single stocks with high passive exposure are becoming more volatile around events over the long run. However, it may simply be that the thesis is, like most of your author’s investment decisions, ‘not wrong, but just early’.
Despite the statistics cited above about inflows into passive funds, as of November 2024, only 26% of the ownership of the median S&P 500 index firm was passive, according to Goldman Sachs. The percentage is actually marginally lower for the Magnificent Seven, with weights between 23% (Microsoft, Nvidia) and 19% (Tesla, Amazon). The stocks with the highest passive ownership are, no disrespect meant, a lot more boring: four of the top five are REITs and one is a pest control company.
We think this highlights that there is a difference between actively managed funds and active investing. While US investors have increasingly favoured passive funds over active in recent years, this doesn’t mean they aren’t also investing in shares themselves. One of the reasons for the rise in passive investment over the past two decades is the shift to defined contribution pensions. These favour passives, not only because the low charges attract investors, but because the default funds are typically passive target date funds.
According to Vanguard, 64% of total retirement contributions in the US went into target date funds in 2023, up from 59% in 2022 (cited by Apollo). But the stock investments of US households are certainly not limited to their pension funds. Retail may invest passively in their pensions, but actively elsewhere.
In fact, there are plenty of indications that active investing in the large US stocks by retail investors is on the rise, just not via active funds. The pandemic saw a surge of retail investors enter the market, as stimulus checks had to be spent on something and the bars and shops were closed. In 2021, retail investors were responsible for 25% of total equities trading volume, and average volumes have only risen since then.
Options trading has also become democratised and allowed retail investors another means of getting exposure and with leverage too. Average daily volumes of US equity options traded rose in 2021 and have remained at elevated levels, according to CBOE data. Indeed, it is not just US retail investors. In recent years CBOE has introduced even earlier pre-market trading to allow Asian retail investors to participate too. While pre-market orders and total volumes declined slightly after the 2021 memestock spike, they have remained at a level higher than pre-pandemic.
It was retail, with the options trading strategy, in the Starbucks café
All these measures just cited: retail participation, options trading volume and pre-market trading, spiked in Q4 2024 and have remained elevated this year so far. We think this heavy active retail participation is responsible for the recent volatility around earnings releases, and the rise in the volatility of the largest companies over the past two quarters is more likely because they are the most commonly traded by retail. In fact, the four US stocks with the highest open interest in options are Nvidia, Tesla Inc (NASDAQ:TSLA), Intel Corp (NASDAQ:INTC) and Apple, with three of the four having a market cap above $500 billion. We also note that the stock which departs the most from the pattern of index volatility in the charts above is Amazon, the mega-cap with the lowest passive ownership and highest active ownership. In our view, it’s not so much the absence of active liquidity that is behind the recent surge in volatility, but a surfeit.
We also think the data above suggests this is a shorter-term cycle. There is no clear trend to greater single stock volatility over the long term, but more recent spikes in single stock volatility have occurred around macro developments. In our view, it may be that the leading stocks in the market are becoming more sensitive to hot money flows from retail, and those flows could evaporate in future.
What does this mean for investors?
If our analysis is right, the opportunity for active management probably is increasing, albeit for different reasons. It also suggests that investors should stop being frightened of investing actively in the US, and particularly in the mega-caps. For years, investors have been told it’s not worth investing actively in this market, as it is so efficient, but this is far from clear. We don’t think rising retail participation implies greater efficiency, nor does greater volatility around earnings. Indeed, there are plenty of examples of active managers successfully picking stocks in recent years amidst this supposedly difficult market for active managers. JPMorgan Global Growth & Income Ord (LSE:JGGI)is among the active products to have benefitted from successful active stock selection in US mega-caps. The trust’s most recent annual results discussed positive stock selection from Nvidia, Amazon and Meta Platforms Inc Class A (NASDAQ:META). JGGI continues to be something of a phenomenon in the closed-ended space, soon to absorb yet another competitor, Henderson International Income Ord (LSE:HINT), subject to shareholder approval.
JGGI invests in a global benchmark, so the weights of these stocks are not as high as they are in the US-only indices. But JPMorgan American Ord (LSE:JAM)has also managed to add value with stock picking amongst the US mega-caps, even though it benchmarks itself against the S&P 500 Index. In the last half-year results, to end June, it reported positive attribution from Nvidia and Meta, while not holding Nvidia’s competitor Intel at all also boosted returns. JAM is interesting because it owns a value portfolio as well as a growth portfolio and has outperformed the S&P 500 Index in recent years regardless. So, style swings and a concentrated index don’t have to be a bar to active managers outperforming. JAM has outperformed the S&P 500 Index in NAV total return terms over three-, five- and ten-year periods.
We often hear that a concentrated market makes life tough for stock pickers. This shouldn’t really be an excuse in the closed-ended market, as trusts are not subject to the UCITs rules on single-stock concentration. Moreover, the US market is not as concentrated as one might think: the largest two stocks have weights of 7.2% and 6.5% in the S&P 500 index, so there is plenty of scope for managers to add value with overweights even if they are capping their single stock exposure at 10%.
One manager who is certainly not interested in capping single-stock weights is Mark Chapman of Manchester & London Ord (LSE:MNL). Nvidia makes up 37% of his portfolio and Microsoft 24%. Although it is not the formal benchmark, the MSCI USA Information Technology Index is a reasonable comparator, and MNL is even overweight the 18% weights both these stocks have individually in that index. This concentrated approach has helped deliver stellar returns in recent years. It’s interesting to note though, that Mark has reduced the gearing on his trust in recent months, and reports some stocks in the technology sector are looking a bit expensive. It will be interesting to note how the concentrated approach fares if US tech does enter a weaker period.
Conclusions
An old saying in markets is that when the US sneezes, the rest of the world catches a cold. US economic and social trends are often upstream of us, and in our view the UK is likely to see single-stock investing, options trading and similar leveraged active stock picking become ever more popular too.
As discussed above, we think this trend means the opportunity for active management remains substantial, in the UK market as in the US, and may even be increasing. Moreover, we think the success of a number of talented managers in the investment trust sector shows active management can be a good choice even in a supposedly efficient market like US mega-caps.
There is another impact to bear in mind though. We think the increasing number of options for UK retail investors is a challenge for the active fund industry. Active funds will have to appeal to new generations who are more comfortable with risk, happy to make stock picks and take on leverage. It is the truly active, which can demonstrate they offer something differentiated, that are likely to thrive in such an environment. In our view, the closed-ended fund structure is the superior one to meet that challenge. Trusts can gear, are free from the 10%/40% UCITs concentration limits and able to invest in illiquid assets and those unavailable on the mainstream exchanges. We think the latest step in Saba’s campaign is likely to have brought into focus the need to use these distinguishing features of investment trusts to justify their continued existence.
Our recent event, Rated by Kepler, invited the managers of seven trusts which have won a rating for 2025 to present to our audience. You can watch the recordings and view the presentations at the site here. We think they all bring something special to the table, be that a differentiated strategy, investing in a hard-to-access market or using the flexibility of investment trusts for income.
Kepler Partners is a third-party supplier and not part of interactive investor. Neither Kepler Partners or interactive investor will be responsible for any losses that may be incurred as a result of a trading idea.
These articles are provided for information purposes only. Occasionally, an opinion about whether to buy or sell a specific investment may be provided by third parties. The content is not intended to be a personal recommendation to buy or sell any financial instrument or product, or to adopt any investment strategy as it is not provided based on an assessment of your investing knowledge and experience, your financial situation or your investment objectives. The value of your investments, and the income derived from them, may go down as well as up. You may not get back all the money that you invest. The investments referred to in this article may not be suitable for all investors, and if in doubt, an investor should seek advice from a qualified investment adviser.
Full performance can be found on the company or index summary page on the interactive investor website. Simply click on the company's or index name highlighted in the article.
Important Information
Kepler Partners is not authorised to make recommendations to Retail Clients. This report is based on factual information only, and is solely for information purposes only and any views contained in it must not be construed as investment or tax advice or a recommendation to buy, sell or take any action in relation to any investment.
This report has been issued by Kepler Partners LLP solely for information purposes only and the views contained in it must not be construed as investment or tax advice or a recommendation to buy, sell or take any action in relation to any investment. If you are unclear about any of the information on this website or its suitability for you, please contact your financial or tax adviser, or an independent financial or tax adviser before making any investment or financial decisions.
The information provided on this website is not intended for distribution to, or use by, any person or entity in any jurisdiction or country where such distribution or use would be contrary to law or regulation or which would subject Kepler Partners LLP to any registration requirement within such jurisdiction or country. Persons who access this information are required to inform themselves and to comply with any such restrictions. In particular, this website is exclusively for non-US Persons. The information in this website is not for distribution to and does not constitute an offer to sell or the solicitation of any offer to buy any securities in the United States of America to or for the benefit of US Persons.
This is a marketing document, should be considered non-independent research and is subject to the rules in COBS 12.3 relating to such research. It has not been prepared in accordance with legal requirements designed to promote the independence of investment research.
No representation or warranty, express or implied, is given by any person as to the accuracy or completeness of the information and no responsibility or liability is accepted for the accuracy or sufficiency of any of the information, for any errors, omissions or misstatements, negligent or otherwise. Any views and opinions, whilst given in good faith, are subject to change without notice.
This is not an official confirmation of terms and is not to be taken as advice to take any action in relation to any investment mentioned herein. Any prices or quotations contained herein are indicative only.
Kepler Partners LLP (including its partners, employees and representatives) or a connected person may have positions in or options on the securities detailed in this report, and may buy, sell or offer to purchase or sell such securities from time to time, but will at all times be subject to restrictions imposed by the firm's internal rules. A copy of the firm's conflict of interest policy is available on request.
Past performance is not necessarily a guide to the future. The value of investments can fall as well as rise and you may get back less than you invested when you decide to sell your investments. It is strongly recommended that Independent financial advice should be taken before entering into any financial transaction.
PLEASE SEE ALSO OUR TERMS AND CONDITIONS
Kepler Partners LLP is a limited liability partnership registered in England and Wales at 9/10 Savile Row, London W1S 3PF with registered number OC334771.
Kepler Partners LLP is authorised and regulated by the Financial Conduct Authority.