FTSE for Friday: will more records be broken?
It's taken a while, but investors are having their patience in UK blue-chips rewarded as the index continues to make record highs. Here's what independent analyst Alistair Strang thinks might happen next.
31st January 2025 07:35
by Alistair Strang from Trends and Targets

The FTSE 100 is a market which has been slow to grow, but once up should hopefully present a stronger resistance to any coming storms. While we're often frustrated by the often useless UK market place, recent events perhaps indicate the pace of movement may actually become useful.
- Invest with ii: Open a Stocks & Shares ISA | ISA Investment Ideas | Transfer a Stocks & Shares ISA
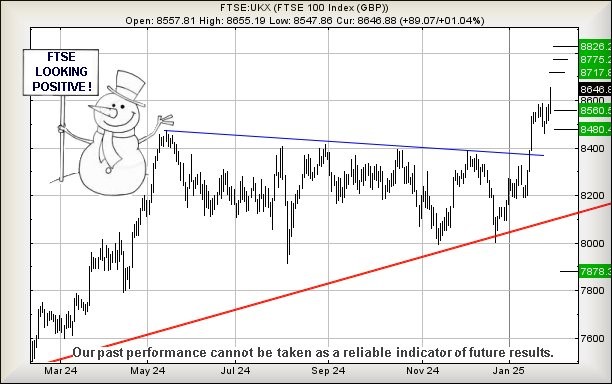
For instance, last Friday we laid out criteria for the UK market to experience some gains, writing "above 8,585 points risks triggering further recovery to an initial 8,643". With the FTSE 100 closing Thursday at 8,646 points, almost exactly at our target level, the 58-point gain which took five sessions to achieve was both impressive and extremely annoying.
It used to be the case where a movement such as this would occur generally within a single session, it comes after a week where the UK market (open to close values) experienced 1 point, 30 points, 24 points, and finally 89 points on Thursday. No matter which way we look at the painful trudge to our target level, waiting for five sessions to pick up 58 points to our initial target level was a pretty foul scenario for traders. While the concept of timeframes remains something quite beyond us, it is also a reminder to "get a feel" of the market as you'll usually fulfil your worst fears.
Currently, should the FTSE manage to exceed just 8,664 points, we calculate the index should next enter a cycle to an initial 8,717 points with our secondary, if bettered, working out at 8,775 points. Neither target level is visually improbable, and overall we shall have no option but to assume an eventual visit to 8,825 points can be anticipated. If exhibiting blind faith in this picture, the tightest stop loss looks like 8,600 points.
Our converse scenario expects index movement below 8,600 to trigger reversals to an initial 8,560 points with our secondary, if broken, presenting itself as a bottom of 8,480 points, along with a very possible bounce.
Have a good weekend.
Source: Trends and Targets. Past performance is not a guide to future performance.
Alistair Strang has led high-profile and "top secret" software projects since the late 1970s and won the original John Logie Baird Award for inventors and innovators. After the financial crash, he wanted to know "how it worked" with a view to mimicking existing trading formulas and predicting what was coming next. His results speak for themselves as he continually refines the methodology.
Alistair Strang is a freelance contributor and not a direct employee of Interactive Investor. All correspondence is with Alistair Strang, who for these purposes is deemed a third-party supplier. Buying, selling and investing in shares is not without risk. Market and company movement will affect your performance and you may get back less than you invest. Neither Alistair Strang or Interactive Investor will be responsible for any losses that may be incurred as a result of following a trading idea.
These articles are provided for information purposes only. Occasionally, an opinion about whether to buy or sell a specific investment may be provided by third parties. The content is not intended to be a personal recommendation to buy or sell any financial instrument or product, or to adopt any investment strategy as it is not provided based on an assessment of your investing knowledge and experience, your financial situation or your investment objectives. The value of your investments, and the income derived from them, may go down as well as up. You may not get back all the money that you invest. The investments referred to in this article may not be suitable for all investors, and if in doubt, an investor should seek advice from a qualified investment adviser.
Full performance can be found on the company or index summary page on the interactive investor website. Simply click on the company's or index name highlighted in the article.