eyeQ: this US tech stock looks vulnerable
Experts at eyeQ have used AI and their own smart machine to analyse macro conditions and generate actionable trading signals. Now, this quantum computing stock has given a bearish signal.
22nd April 2025 10:20
by Huw Roberts from eyeQ

“Our signals are crafted through macro-valuation, trend analysis, and meticulous back-testing. This combination ensures a comprehensive evaluation of an asset's value, market conditions, and historical performance.” eyeQ
- Discover: eyeQ analysis explained | eyeQ: our smart machine in action | Glossary
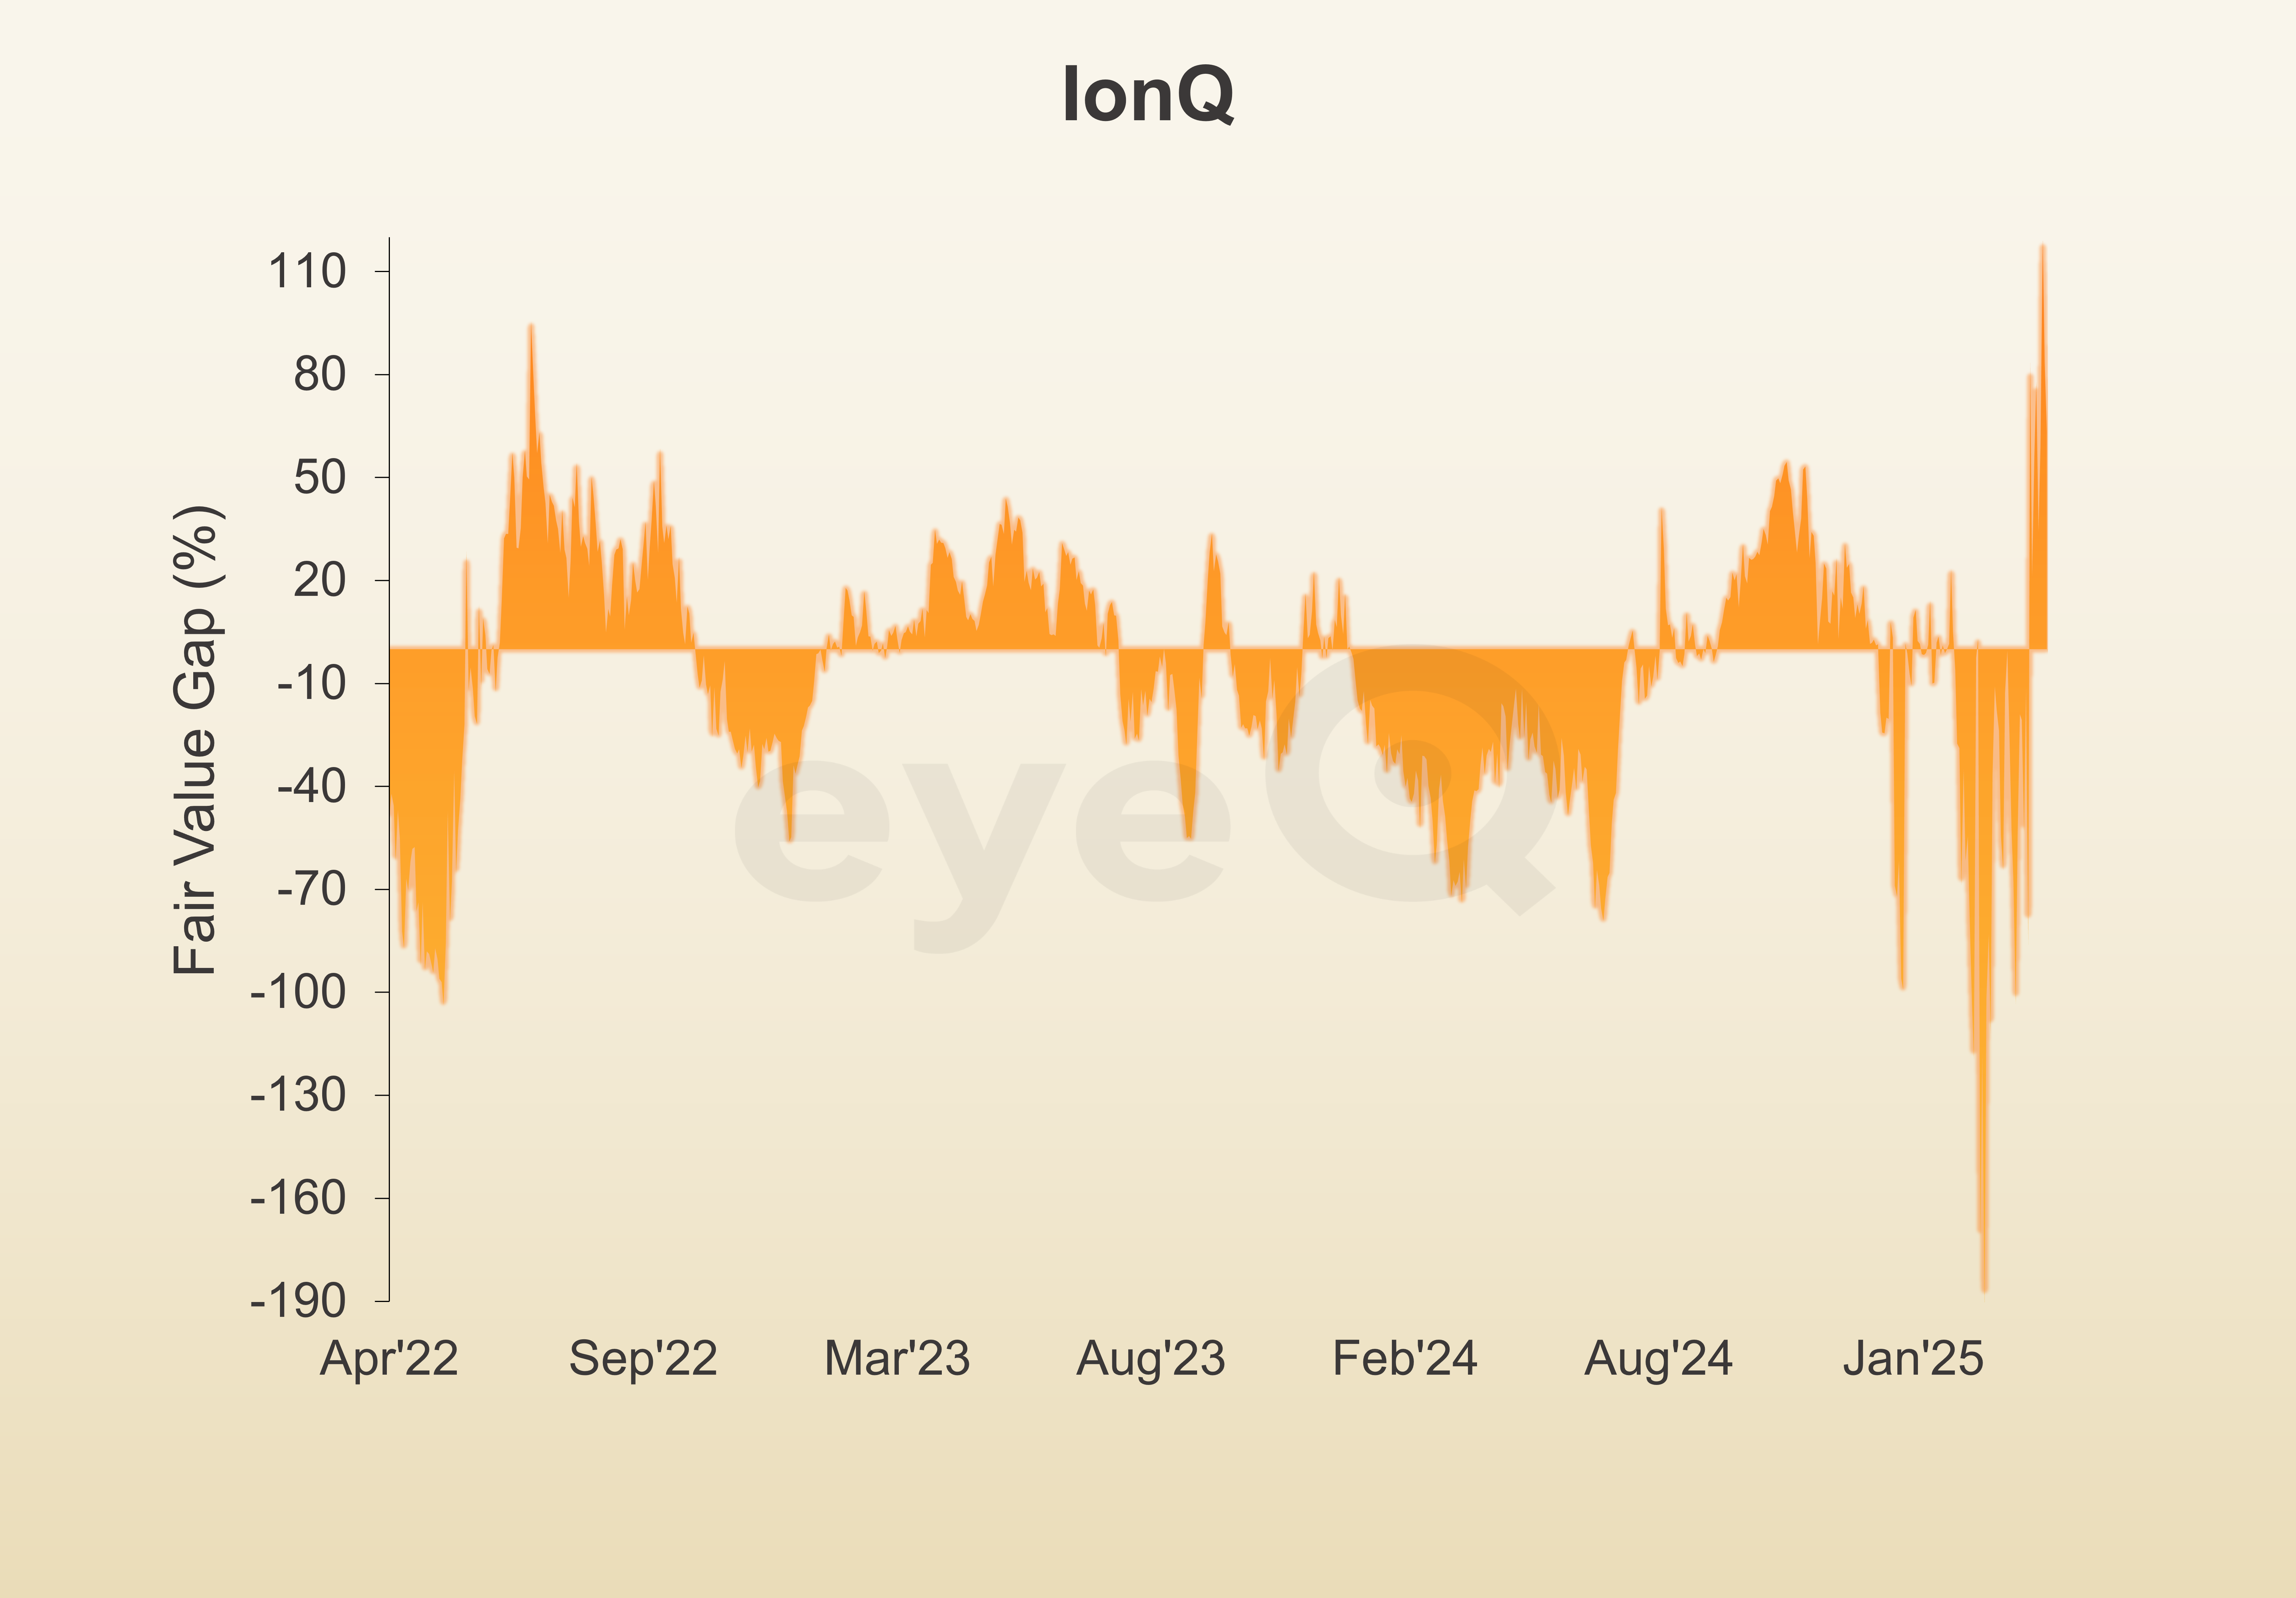
IonQ
Macro Relevance: 74%
Model Value: $8.80
Fair Value Gap: +63.4% premium to model value
Data correct as at 22 April 2025. Please click glossary for explanation of terms. Long-term strategic model.
Even with a bounce into last night’s close, US tech stocks continue to take a beating. Every Magnificent Seven stock is now down more than 25% except for Microsoft Corp (NASDAQ:MSFT), which is “only” down 23%.
While global trade wars have been the catalyst for the downturn, the truth is these stocks were sporting extremely rich valuations even before Trump took office. In that vein, it’s worth thinking about other areas of tech where valuations were chased aggressively higher in recent years.
Quantum computing stocks exploded on to the scene at the end of 2023 when Google introduced its Willow computing chip. 2024 was a great year for names such as IonQ Inc Class A (NYSE:IONQ), Rigetti Computing Inc (NASDAQ:RGTI), D-Wave Quantum Inc (NYSE:QBTS) and Quantum Computing Inc (NASDAQ:QUBT) all of which rallied hard and became popular stocks among retail investors.
Most hit their highs in January when Microsoft argued that businesses needed to get “quantum ready”, but since then the mood music has changed. Among others, NVIDIA Corp (NASDAQ:NVDA)’s Jensen Huang and Meta Platforms Inc Class A (NASDAQ:META)’s Mark Zuckerberg have warned that quantum computing could be a decade or more away.
From the macro perspective, eyeQ model value has been falling aggressively. It’s down 83% year-to-date with the speed of that deterioration accelerating of late. Today, overall macro conditions are consistent with IonQ trading below $10. The stock price hasn’t fallen to the same degree, and it’s now triggered a bearish signal.
These are volatile stocks. And macro conditions are extremely volatile too given all the headlines flying around from the White House. It is not a stock for the faint-hearted and any position requires extra due diligence. That said, from the macro side of things, the big picture environment continues to deteriorate, and the stock has not reflected that. It looks vulnerable on our metrics.
Source: eyeQ. Past performance is not a guide to future performance.
Useful terminology:
Model value
Where our smart machine calculates that any stock market index, single stock or exchange-traded fund (ETF) should be priced (the fair value) given the overall macroeconomic environment.
Model (macro) relevance
How confident we are in the model value. The higher the number the better! Above 65% means the macro environment is critical, so any valuation signals carry strong weight. Below 65%, we deem that something other than macro is driving the price.
Fair Value Gap (FVG)
The difference between our model value (fair value) and where the price currently is. A positive Fair Value Gap means the security is above the model value, which we refer to as “rich”. A negative FVG means that it's cheap. The bigger the FVG, the bigger the dislocation and therefore a better entry level for trades.
Long Term model
This model looks at share prices over the last 12 months, captures the company’s relationship with growth, inflation, currency shifts, central bank policy etc and calculates our key results - model value, model relevance, Fair Value Gap.
These third-party research articles are provided by eyeQ (Quant Insight). interactive investor does not make any representation as to the completeness, accuracy or timeliness of the information provided, nor do we accept any liability for any losses, costs, liabilities or expenses that may arise directly or indirectly from your use of, or reliance on, the information (except where we have acted negligently, fraudulently or in wilful default in relation to the production or distribution of the information).
The value of your investments may go down as well as up. You may not get back all the money that you invest.
Equity research is provided for information purposes only. Neither eyeQ (Quant Insight) nor interactive investor have considered your personal circumstances, and the information provided should not be considered a personal recommendation. If you are in any doubt as to the action you should take, please consult an authorised financial adviser.
Disclosure
We use a combination of fundamental and technical analysis in forming our view as to the valuation and prospects of an investment. Where relevant we have set out those particular matters we think are important in the above article, but further detail can be found here.
Please note that our article on this investment should not be considered to be a regular publication.
Details of all recommendations issued by ii during the previous 12-month period can be found here.
ii adheres to a strict code of conduct. Contributors may hold shares or have other interests in companies included in these portfolios, which could create a conflict of interests. Contributors intending to write about any financial instruments in which they have an interest are required to disclose such interest to ii and in the article itself. ii will at all times consider whether such interest impairs the objectivity of the recommendation.
In addition, individuals involved in the production of investment articles are subject to a personal account dealing restriction, which prevents them from placing a transaction in the specified instrument(s) for a period before and for five working days after such publication. This is to avoid personal interests conflicting with the interests of the recipients of those investment articles.