eyeQ: UK housing - macro reality bites
interactive investor has teamed up with the experts at eyeQ who use artificial intelligence and their own smart machine to analyse macro conditions and generate actionable trading signals. This time it spots a stock that’s significantly overvalued.
13th June 2024 11:57
by Huw Roberts from eyeQ

"Our signals are crafted through macro-valuation, trend analysis, and meticulous back-testing. This combination ensures a comprehensive evaluation of an asset's value, market conditions, and historical performance." eyeQ
- Discover: eyeQ analysis explained | eyeQ: our smart machine in action | Glossary
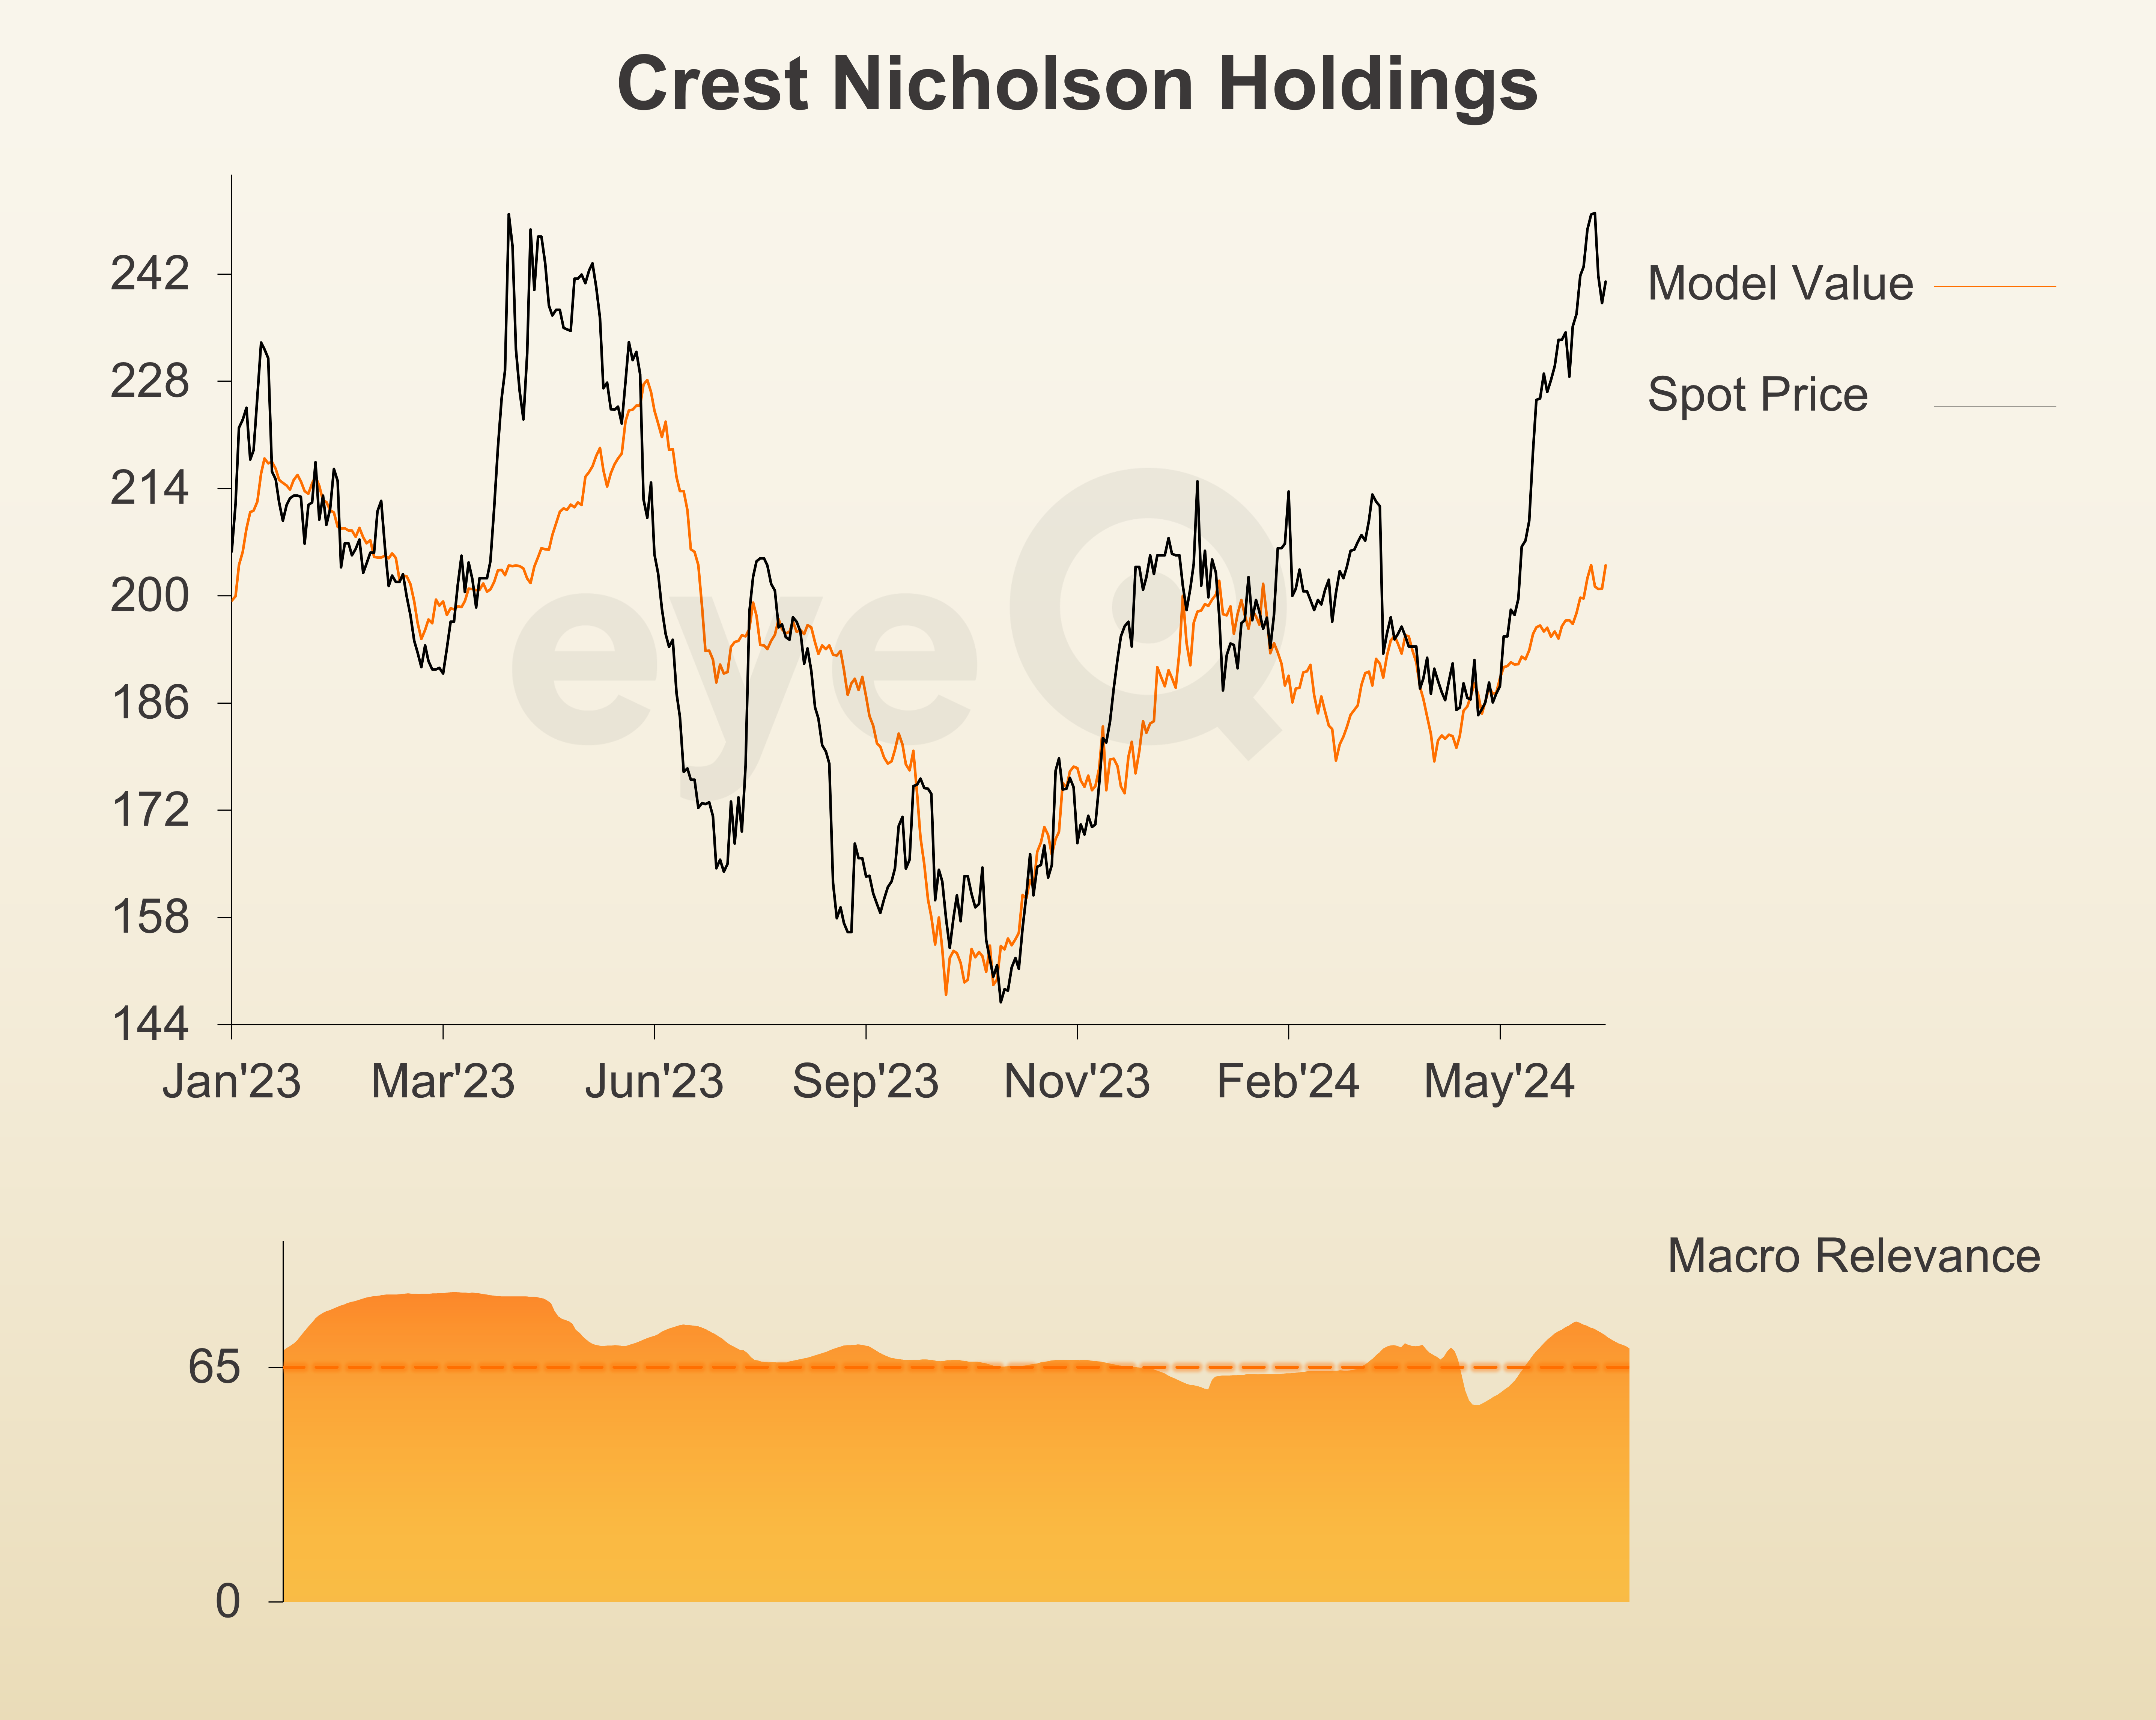
Crest Nicholson
Trading signal: long-term strategic model
Model value: 203.78p
Fair Value Gap: +15.37% premium to model value
Model relevance: 70%
Data correct as at 13 June 2024. Please click glossary for explanation of terms.
We’ve had two critical bits of news on UK housing today.
The excellent Royal Institute of Chartered Surveyors RICS report was released, and it suggests hopes of a recovery in UK property might be stalling. For the last six months the RICS price balance series has been rising. Surveyors became more busy as hopes of a Bank of England (BoE) rate cut started to feed through into lower mortgage rates and renewed movement in the property market. The latest number fell back once again - election uncertainty and less confidence that we’ll get rate cuts are seemingly hurting sentiment.
Then we got anecdotal evidence on the health of the housing market from property developer Crest Nicholson Holdings (LSE:CRST). Sadly, it wasn’t great news. First-half profit came in lower than expected, and was compounded by management cutting guidance for full-year earnings too.
The result was a sharp sell-off in the stock, which is now down 11.5% from the June highs.
The eyeQ machine is not surprised. At those June highs, Crest screened as 19.5% rich to overall macro conditions. Even with this recent sell-off, the stock still sits 15.4% above where the big picture stuff such as growth and inflation, the BoE’s policy stance say it should.
It is important to note the orange line is moving higher – macro conditions are getting better. It’s just that the rally of the last few months overshot fundamentals. Put another way, people got over-excited about BoE rate cuts and a bounce in the property market. Now the market is re-pricing the stock back down to macro reality.
All eyes are now on the Labour manifesto and whether their pledge to get Britain building again can bring in some good news.
Source: eyeQ. Past performance is not a guide to future performance.
Useful terminology:
Model value
Where our smart machine calculates that any stock market index, single stock or exchange-traded fund (ETF) should be priced (the fair value) given the overall macroeconomic environment.
Model (macro) relevance
How confident we are in the model value. The higher the number the better! Above 65% means the macro environment is critical, so any valuation signals carry strong weight. Below 65%, we deem that something other than macro is driving the price.
Fair Value Gap (FVG)
The difference between our model value (fair value) and where the price currently is. A positive Fair Value Gap means the security is above the model value, which we refer to as “rich”. A negative FVG means that it's cheap. The bigger the FVG, the bigger the dislocation and therefore a better entry level for trades.
Long Term model
This model looks at share prices over the last 12 months, captures the company’s relationship with growth, inflation, currency shifts, central bank policy etc and calculates our key results - model value, model relevance, Fair Value Gap.
These third-party research articles are provided by eyeQ (Quant Insight). interactive investor does not make any representation as to the completeness, accuracy or timeliness of the information provided, nor do we accept any liability for any losses, costs, liabilities or expenses that may arise directly or indirectly from your use of, or reliance on, the information (except where we have acted negligently, fraudulently or in wilful default in relation to the production or distribution of the information).
The value of your investments may go down as well as up. You may not get back all the money that you invest.
Equity research is provided for information purposes only. Neither eyeQ (Quant Insight) nor interactive investor have considered your personal circumstances, and the information provided should not be considered a personal recommendation. If you are in any doubt as to the action you should take, please consult an authorised financial adviser.
Disclosure
We use a combination of fundamental and technical analysis in forming our view as to the valuation and prospects of an investment. Where relevant we have set out those particular matters we think are important in the above article, but further detail can be found here.
Please note that our article on this investment should not be considered to be a regular publication.
Details of all recommendations issued by ii during the previous 12-month period can be found here.
ii adheres to a strict code of conduct. Contributors may hold shares or have other interests in companies included in these portfolios, which could create a conflict of interests. Contributors intending to write about any financial instruments in which they have an interest are required to disclose such interest to ii and in the article itself. ii will at all times consider whether such interest impairs the objectivity of the recommendation.
In addition, individuals involved in the production of investment articles are subject to a personal account dealing restriction, which prevents them from placing a transaction in the specified instrument(s) for a period before and for five working days after such publication. This is to avoid personal interests conflicting with the interests of the recipients of those investment articles.