Commodities outlook: Sellers attack both oil and gold again
A stock market crash may have made life tough for this normally safe port in a storm.
12th March 2020 13:33
by Rajan Dhall from interactive investor
A stock market crash may have made life tough for this normally safe port in a storm.

Since the last report, all hell has broken loose in the oil markets. OPEC failed to get agreement made which angered the Saudi's, and now the nation has vowed to increase production to near full capacity after years of curbs.
Russia apparently could not agree to the extra cuts, saying that companies and delegates would not pass them. All of this had a massive knock-on effect for other macro markets. Stock indices had already been struggling with the effects of the coronavirus and now a new issue has compounded woes.
Yesterday, the Energy Information Administration's (EIA) also released its latest oil report. Rather than a move above the 14 million barrel per day threshold in late 2021, predicted just last month, the EIA now think US oil production will soon peak at little more than 13.2 million barrels before falling sharply. More bad news then.
Interestingly, there is a breakeven rate for shale producers in the States, and a lot of US shale drillers cannot make a living at current oil prices. Also, investors must also consider industry capital expenditure, bankrolled by borrowed money. If the oil price dips too low, many projects will not be viable.
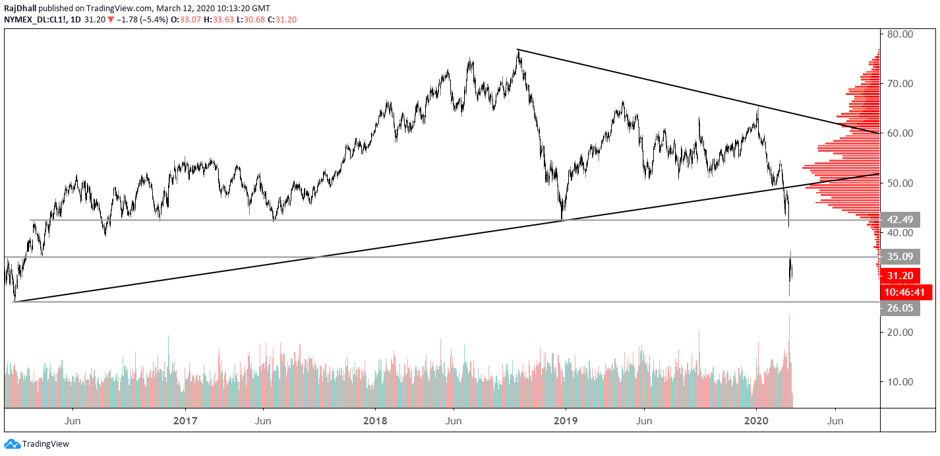
From a technical perspective, the chart below just failed to reach the $26.05 per barrel lows. The price has bounced back and could test the top of the consolidation around $35.09 per barrel. There is always the possibility that the gap could be filled but the news coming out of Saudi Arabia and Russia does not appear bullish enough for that to happen.

Source: TradingView Past performance is not a guide to future performance
In this time of turmoil, gold has managed to pull back, which has been a surprise. It has been suggested that the drop in the precious metal can be attributed to investors needing to cover margins in their declining stock positions.
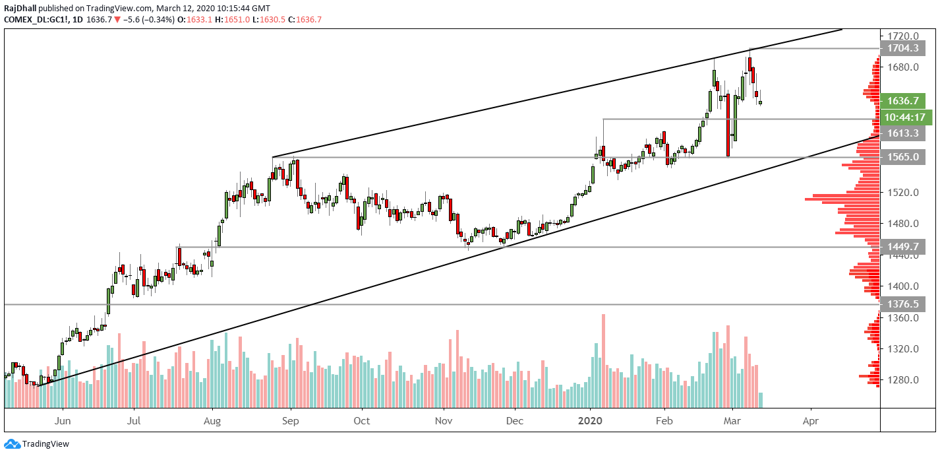
There are some key support and resistance levels to watch out for now and, on the downside, the $1,613.3 support zone could be an area where buying kicks in.
Above current levels, $1,704.3 per ounce is the main resistance. If this level is broken to the upside it would be safe to assume the market will try and attack historical highs.

Source: TradingView Past performance is not a guide to future performance
Rajan Dhall is a freelance contributor and not a direct employee of interactive investor.
These articles are provided for information purposes only. Occasionally, an opinion about whether to buy or sell a specific investment may be provided by third parties. The content is not intended to be a personal recommendation to buy or sell any financial instrument or product, or to adopt any investment strategy as it is not provided based on an assessment of your investing knowledge and experience, your financial situation or your investment objectives. The value of your investments, and the income derived from them, may go down as well as up. You may not get back all the money that you invest. The investments referred to in this article may not be suitable for all investors, and if in doubt, an investor should seek advice from a qualified investment adviser.
Full performance can be found on the company or index summary page on the interactive investor website. Simply click on the company's or index name highlighted in the article.