Chart of the week: will Amazon’s results be blockbuster or bust?
All eyes are on the online shopping giant ahead of its Q1 earnings announcement this week.
26th April 2021 17:18
by John Burford from interactive investor
All eyes are on the online shopping giant ahead of its Q1 earnings announcement this week.

It's no secret that Amazon (NASDAQ:AMZN) is having a great pandemic – and just how great will be outlined this week in its Q1 earnings results on 29 April. But since last August, when the all-time high of $3,580 (£2,574) was achieved, the shares have gone nowhere as investors have digested the massive gains since the depths of the coronavirus crash lows of March 2020.
Back then, the shares traded at $1,625 and have improved by a mighty 120%. That's the kind of performance recorded by tech start-ups, but Amazon hardly qualifies as one – its market cap is now $1.7 trillion (or about 60% of UK GDP).
So the question is: has this stunning year-long re-rating discounted any possible bullish future scenario that has taken its price-to-earnings (P/E) ratio to a hefty 80? Or are we near 'Peak Amazon', with governments (especially in the European Union) increasingly worried about the global dominance of US big tech firms – and seeming to be gearing up to do something about it – and the thorny issue of how much tax it pays?
- Special offer: no trading fees on US shares for this week only
- US earnings to watch this week: Tesla, Alphabet, Apple and Amazon
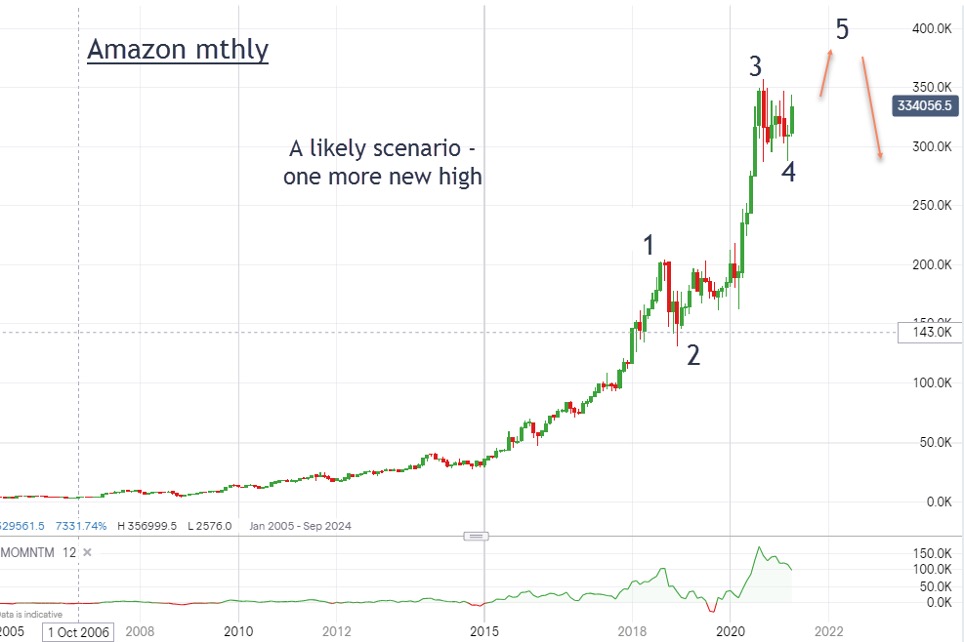
Here is the impressive bull run from the early days:

Past performance is not a guide to future performance.
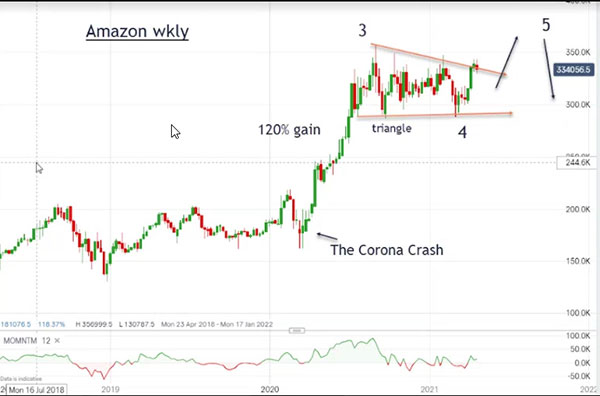
I have labelled the Elliott waves such that we should have one more wave up into new highs. Here is a close-up of waves three and four on the weekly:

Past performance is not a guide to future performance.
In fact, wave four appears to be in a classic wedge/triangle, with wave five about to surge up into new high ground. If that occurs, when wave five terminates the market will begin a lengthy decline to at least the $3,000 region, and likely much lower.
But note the effect of the crash last year – it put hardly a blip on the market's progress! In fact, it kicked off the 120% uptick as investors realised that, in lockdowns, internet commerce would flourish at the expense of high street retail.
- Stockwatch: a stock to buy after its dramatic share price crash?
- Are you saving enough for retirement? Our calculator can help you find out
So my best guess is that after some possible volatility surrounding Thursday's data release, the shares should continue northwards. If so then that would be the end of the decades-long wave pattern and lead to a multi-month decline at least.
Of course, I have no firm idea what adverse background economic and financial conditions would prevail under this scenario. One would be a sharp spike up in interest rates that I have been mentioning in these pages. Hmm.
John Burford is the author of the definitive text on his trading method, Tramline Trading. He is also a freelance contributor and not a direct employee of interactive investor.
Disclosure
We use a combination of fundamental and technical analysis in forming our view as to the valuation and prospects of an investment. Where relevant we have set out those particular matters we think are important in the above article, but further detail can be found here.
Please note that our article on this investment should not be considered to be a regular publication.
Details of all recommendations issued by ii during the previous 12-month period can be found here.
ii adheres to a strict code of conduct. Contributors may hold shares or have other interests in companies included in these portfolios, which could create a conflict of interests. Contributors intending to write about any financial instruments in which they have an interest are required to disclose such interest to ii and in the article itself. ii will at all times consider whether such interest impairs the objectivity of the recommendation.
In addition, individuals involved in the production of investment articles are subject to a personal account dealing restriction, which prevents them from placing a transaction in the specified instrument(s) for a period before and for five working days after such publication. This is to avoid personal interests conflicting with the interests of the recipients of those investment articles.