Chart of the week: why I’m buying banks again
Have banks now made their lows and are poised for a decent rally phase? Our analyst gives his view.
6th July 2020 12:02
by John Burford from interactive investor
Have banks now made their lows and are poised for a decent rally phase? Our analyst gives his view.

Has HSBC reached its nadir and now poised to rally?
As long-time readers of mine well know, I have been relentlessly bearish on the banking sector for many months (and a few years!). But just as day always follows night, a bear trend always transforms into the opposite trend at some stage. I am asking the question – have banks now reached their lows are they poised for a decent rally phase?
There is little question sentiment towards the banks is hugely negative. For one thing, the pandemic recession seen by many is set to get a whole lot worse into the winter. Then, predictions of swathes of layoffs abound when the furlough schemes taper off in a few weeks. That is when house repossessions will spike as mortgage payments will be missed.
That is the usual narrative for the UK.
And HSBC (LSE:HSBA), with its strong connection to Hong Kong, is extra vulnerable with China now appearing to want to absorb it into its clutches. Forecasts for a severe weakening of HK as a major financial centre are thick on the ground. The outlook for the bank appears bleak indeed.
And that is why I am making a case for the shares as a strong buy. Remember, markets make lows not when confidence is high, but when all seems lost.
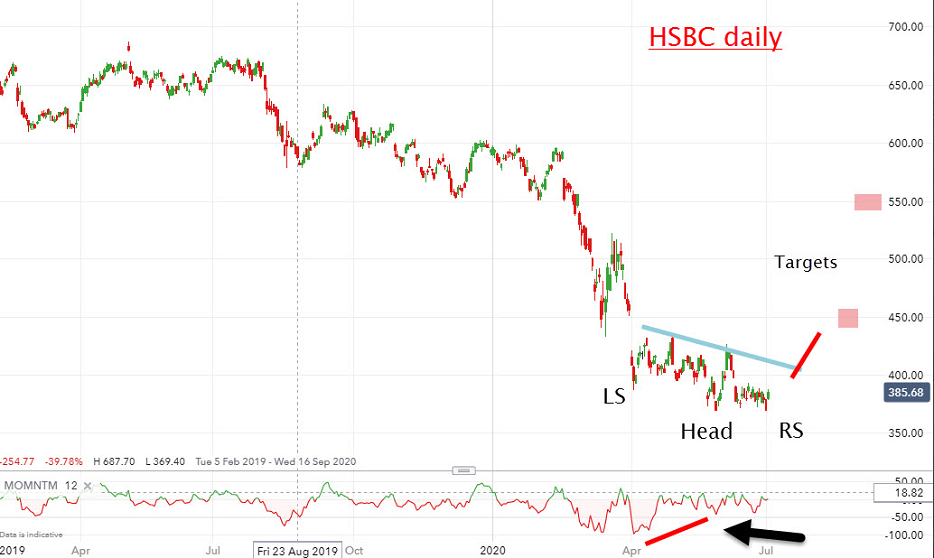
Here is the daily chart:

Source: interactive investor. Past performance is not a guide to future performance.
The slide off the 2019 highs around £6.80 has been relentless, and when news of the pandemic hit the headlines in March, a huge breakaway gap opened up. But the pattern to note is that, in the last few weeks, the mini-waves have been highly overlapping and are forming a possible Head and Shoulders reversal.
This pattern is well known to chartists, but a genuine instance must also feature a good momentum divergence at the Head compared with that at the Left Shoulder.
And the huge momentum divergence at the ‘Head’ at the £3.70 low on 1 June portends a major rally phase ahead – provided the blue neckline can be penetrated. If so, that would be a major buy signal.
- HSBC profits dive: is there any hope?
- FTSE 100's big winners and losers in 2020 so far
- Take control of your retirement planning with our award-winning, low-cost Self-Invested Personal Pension (SIPP)
In its favour is the advancing bond yields (see my COTW of 15 June) that will boost returns from loans in a very big way if yields do advance, as I judge likely. This is, of course, highly unanticipated by most pundits!
My first target is at the £4.50 region with higher potential.
Monday morning Flash – The shares opened sharply higher this morning on a gap.
For more information about Tramline Traders, or to take a three-week free trial, go to www.tramlinetraders.com.
John Burford is the author of the definitive text on his trading method, Tramline Trading. He is also a freelance contributor and not a direct employee of interactive investor.
These articles are provided for information purposes only. Occasionally, an opinion about whether to buy or sell a specific investment may be provided by third parties. The content is not intended to be a personal recommendation to buy or sell any financial instrument or product, or to adopt any investment strategy as it is not provided based on an assessment of your investing knowledge and experience, your financial situation or your investment objectives. The value of your investments, and the income derived from them, may go down as well as up. You may not get back all the money that you invest. The investments referred to in this article may not be suitable for all investors, and if in doubt, an investor should seek advice from a qualified investment adviser.
Full performance can be found on the company or index summary page on the interactive investor website. Simply click on the company's or index name highlighted in the article.
Disclosure
We use a combination of fundamental and technical analysis in forming our view as to the valuation and prospects of an investment. Where relevant we have set out those particular matters we think are important in the above article, but further detail can be found here.
Please note that our article on this investment should not be considered to be a regular publication.
Details of all recommendations issued by ii during the previous 12-month period can be found here.
ii adheres to a strict code of conduct. Contributors may hold shares or have other interests in companies included in these portfolios, which could create a conflict of interests. Contributors intending to write about any financial instruments in which they have an interest are required to disclose such interest to ii and in the article itself. ii will at all times consider whether such interest impairs the objectivity of the recommendation.
In addition, individuals involved in the production of investment articles are subject to a personal account dealing restriction, which prevents them from placing a transaction in the specified instrument(s) for a period before and for five working days after such publication. This is to avoid personal interests conflicting with the interests of the recipients of those investment articles.