Chart of the week: when will Tesla shares hit a new high?
18th October 2021 11:59
by John Burford from interactive investor
The electric vehicle leader has been written off before, and it’s bounced back every time. Here’s where our technical analyst thinks the shares are going now.

Tesla keeps climbing those Walls of Worry
Long-term investors in Tesla (NASDAQ:TSLA) have had to endure much derision of their CEO – Mr Elon Musk - over the years since inception. There were the infamous tweets where he announced market-moving 'news' which drew the ire of the federal authorities. And the announcement of an electric truck that was about to go into production (which in fact was nowhere near out of the research phase).
Yes, much fun by outsiders have been had by his often chaotic and confusing tweets, especially his views on the Covid virus.
And still, the shares keep marching north. Of course, the cars are hugely popular and recent UK sales figures shows the top seller was the Tesla 3; and China has registered a similar performance. So, he must be doing something right!
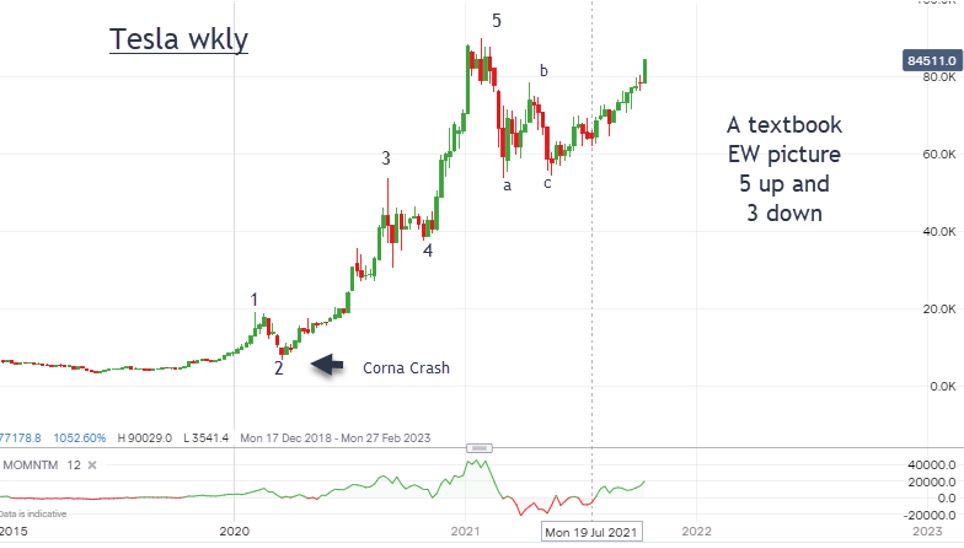
Here is the long-term chart that presents a textbook Elliott wave structure:

Past performance is no guide to future performance
From the early days as long ago as late 2019, the market has risen spectacularly in five clear impulsive waves to the all-time high at $900 set in January.
Production and other problems induced a decline in three clear waves, a-b-c. And from there, the shares have advanced strongly with stronger vehicle sales.
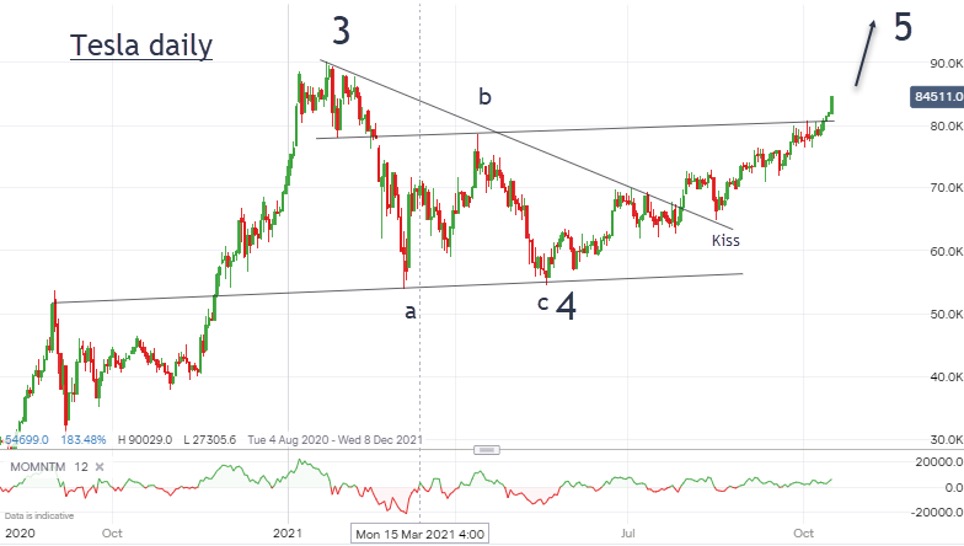
Here is the shorter-term chart showing the structure of wave 4:

Past performance is no guide to future performance
I have slightly different and equally valid wave labels here, but both options imply further moves higher.
In this chart, once the correction had run its course, the shares punched above the down-sloping trendline, which was resistance before the break and now is support.
That was clearly the correct interpretation when the market moved back to plant a kiss on the trendline, and then moved sharply higher in what I call a Scalded Cat Bounce.
At that kiss, the shares were a low-risk buy at around $675.
And last week, the market moved above my upper tramline and is about to test the $900 all-time high. I fully expect that high to be exceeded fairly soon.
Of course, while Tesla is the electric vehicle (EV) of choice for the trendy set, the major auto manufacturers are not sitting on their hands watching Tesla dominate that space. Both German and Chinese auto makers are hot in pursuit, and it is barely conceivable that one or more of them cannot make a huge dent in their dominance.
But the bigger question for investors is this: can the exploding market for EVs mean there is room for almost everybody at this early stage, and even if Tesla is overtaken, can it still make rising profits for the foreseeable future?
Remember, it was only two years ago when EVs were a dream to most and now they are very much a reality.
Today's EV scene looks very much like the early days of the internal combustion engine vehicles a hundred years ago or so. There were very many start-ups then, but most were gone in a few decades and only a few survived into the mature phase of the industry in the 1950s.
Possible bumps on the road for EV’s are battery technology and lithium supply as well as the UK's problem of charging points for flat dwellers. As always in technology, where there is a will (profit), there is (almost) always a way.
John Burford is the author of the definitive text on his trading method, Tramline Trading. He is also a freelance contributor and not a direct employee of interactive investor.
These articles are provided for information purposes only. Occasionally, an opinion about whether to buy or sell a specific investment may be provided by third parties. The content is not intended to be a personal recommendation to buy or sell any financial instrument or product, or to adopt any investment strategy as it is not provided based on an assessment of your investing knowledge and experience, your financial situation or your investment objectives. The value of your investments, and the income derived from them, may go down as well as up. You may not get back all the money that you invest. The investments referred to in this article may not be suitable for all investors, and if in doubt, an investor should seek advice from a qualified investment adviser.
Full performance can be found on the company or index summary page on the interactive investor website. Simply click on the company's or index name highlighted in the article.
Disclosure
We use a combination of fundamental and technical analysis in forming our view as to the valuation and prospects of an investment. Where relevant we have set out those particular matters we think are important in the above article, but further detail can be found here.
Please note that our article on this investment should not be considered to be a regular publication.
Details of all recommendations issued by ii during the previous 12-month period can be found here.
ii adheres to a strict code of conduct. Contributors may hold shares or have other interests in companies included in these portfolios, which could create a conflict of interests. Contributors intending to write about any financial instruments in which they have an interest are required to disclose such interest to ii and in the article itself. ii will at all times consider whether such interest impairs the objectivity of the recommendation.
In addition, individuals involved in the production of investment articles are subject to a personal account dealing restriction, which prevents them from placing a transaction in the specified instrument(s) for a period before and for five working days after such publication. This is to avoid personal interests conflicting with the interests of the recipients of those investment articles.