Chart of the week: Stock plunge spells trouble for Tesla
21st January 2019 12:26
by John Burford from interactive investor
It's one of the most popular stocks, but our technical analyst may have spotted a trend change at Tesla.

Is Tesla finally coiling down?
Tesla (NASDAQ:TSLA) is one of the most heavily traded shares and most heavily shorted, which has been a major factor in my decision to mostly avoid trading it - until last week, that is. Another factor was the wide swings since its IPO in 2010 at $17 a share. It was tough to get a handle on its twists and turns.
Investors are strongly divided into the bulls who see Musk as some sort of Messiah who almost single-handedly is taking on the fossil fuel establishment and heroically saving the planet. The bears, on the other hand, see him as a fraud and believe the company is doomed to fail. They believe the mounting competition in electric vehicles will swamp him.
The various company reports have usually been disappointing to the bulls and the shares have been knocked back after release. But then, Musk tweets an outrageous claim – and the shares rebound again and squeeze the shorts. What a great game of ping-pong – but tough for swing traders to extract any profits
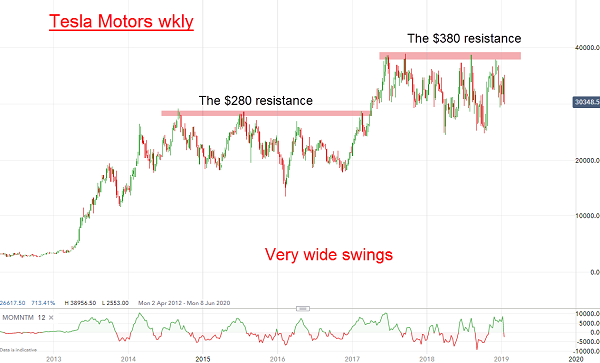
The weekly chart shows those swings where major trends were almost entirely absent, save for the quick run-up in 2013 to the $280 area and since then, the price has traced out a series of downs and ups, but always failing to break above the critical $280 zone:

Source: interactive investor Past peformance is not a guide to future performance
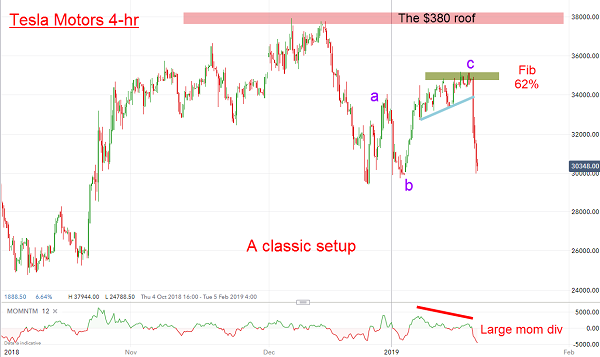
But in March 2017 it did just that and surged to the $380 area. The shares then replicated the previous pattern of tracing out down and ups but never pushing above the $380 'roof'. Here is the short-term picture:

Source: interactive investor Past peformance is not a guide to future performance
In fact, a great trading strategy would have been to short whenever it reached the $380 area and take profits on the dip. Since June 2017 that plan would have worked like a charm. Note that the declines off the $380 hits have been stopped roughly at the $280 area – a resistance that now acts as support.
But the latest hit last December was the prelude to a lovely five-down to the $295 low on December 26 (when most traders were otherwise engaged) – and that was my signal to expect a rally phase consisting of three waves in an A-B-C pattern.
If my hunch was correct that the rally was a correction to the new downtrend, it should push up to the Fibonacci 62% level as my best guess to the $346 region – and then turn down.
In fact, that was a pretty accurate forecast as the high last week was $351 before crashing late in the week to the $300 area.
I was eagle-eyed as it rallied towards my target and noted the momentum was diverging – a clear sign the rally was running out of steam. In fact, that was a classic setup for a short trade of high probability/low risk. Thus, I expect the decline to continue with my stop loss at the $350 area.
Also note that last week's savage decline followed Musk's announcement of job cuts. But we have been here before. The numerous production cuts over the recent past were treated with disdain as the share price often shrugged off the 'negative' news.
So why has this piece of 'bad' news hit the shares so hard this time? The fundamentalists cannot explain the paradox. But if you agree that we have a five-down and a three-up, that is the classic sign of a trend change. No piece of news can alter that.
For more information about Tramline Traders, or to take a three-week free trial, go to www.tramlinetraders.com.
John Burford is the author of the definitive text on his trading method, Tramline Trading. He is also a freelance contributor and not a direct employee of interactive investor.
These articles are provided for information purposes only. Occasionally, an opinion about whether to buy or sell a specific investment may be provided by third parties. The content is not intended to be a personal recommendation to buy or sell any financial instrument or product, or to adopt any investment strategy as it is not provided based on an assessment of your investing knowledge and experience, your financial situation or your investment objectives. The value of your investments, and the income derived from them, may go down as well as up. You may not get back all the money that you invest. The investments referred to in this article may not be suitable for all investors, and if in doubt, an investor should seek advice from a qualified investment adviser.
Full performance can be found on the company or index summary page on the interactive investor website. Simply click on the company's or index name highlighted in the article.
Disclosure
We use a combination of fundamental and technical analysis in forming our view as to the valuation and prospects of an investment. Where relevant we have set out those particular matters we think are important in the above article, but further detail can be found here.
Please note that our article on this investment should not be considered to be a regular publication.
Details of all recommendations issued by ii during the previous 12-month period can be found here.
ii adheres to a strict code of conduct. Contributors may hold shares or have other interests in companies included in these portfolios, which could create a conflict of interests. Contributors intending to write about any financial instruments in which they have an interest are required to disclose such interest to ii and in the article itself. ii will at all times consider whether such interest impairs the objectivity of the recommendation.
In addition, individuals involved in the production of investment articles are subject to a personal account dealing restriction, which prevents them from placing a transaction in the specified instrument(s) for a period before and for five working days after such publication. This is to avoid personal interests conflicting with the interests of the recipients of those investment articles.