Chart of the week: A short ride with Tesla shares
3rd April 2018 09:25
by John Burford from interactive investor
Has Tesla run out of gas?
I have been following the progress of shares for some time as they climbed the infamous Wall of Worry and shrugged off their well-publicised failings to meet production targets and other concerns. I believed it was only a matter of time before investors realised the shares were priced for a scenario that may never happen: that is, actual earnings.
Also, because it has assumed an almost cult-like status, Tesla is unlikely to be the big winner in the electric vehicle stakes. There are plenty of established players who can and will produce a better vehicle.
This major NASDAQ component is a throw-back to the bad old days of the dotcom boom when real company earnings were derided and shunned. All that was needed was 'eyeballs' and a futuristic business model that promised a brave new world where the company would come to dominate as a first mover.
Only has managed this feat in the majors.
Most major tech companies today do have real earnings, but Tesla is one of the few outliers with none - and that is why I decided to focus on this share which should give me a much bigger downside bang for my buck in any bear trend than would the big earners, such as or .
My task then was to stalk the shares and wait for a high probability/low risk opportunity to short them.
As usual, I followed the Elliott waves on the way up - but that was no easy task! In real time, we are always faced with several options and guessing the correct one can be fraught, to put it mildly. But as the patterns develop as the days pass, sometimes the fog clears and greater confidence can be gained in adopting one particular forecast. This is a great example.
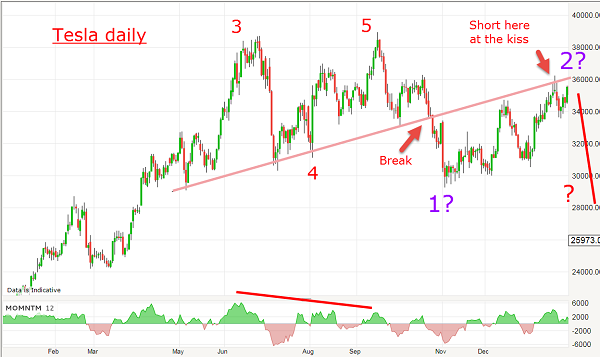
Here is the daily chart on 22 January.

Source: interactive investor Past performance is not a guide to future performance
The high in June was wave 3, then down in wave 4 and the rally to the slight new high at $390 in September was the final wave 5. In October, the shares retreated and I could then draw in the pink minor trendline joining the minor lows. When the market broke below it in late October, that was the first sign the highs were probably in and my wave labels were correct.
The large momentum divergence at the tops was another clue.
The break was sharp but as expected, they again rallied and on two occasions tried to move above the pink trendline - and both times failed.
That second attempt on 22 January was my opportunity to set a short trade at the 360 area using a very close stop. If the market had decided to push above it, I would be out with minimal loss and I would take another look.
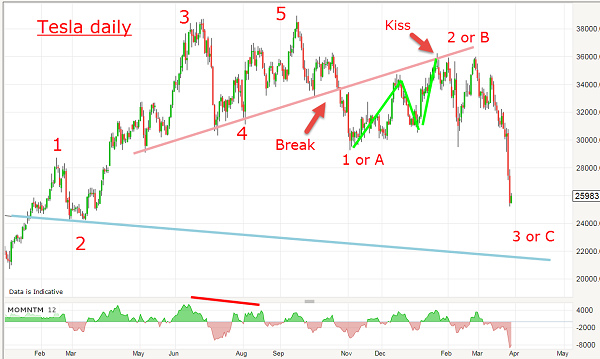
But in fact, that was the rally high and this is the updated chart.

Source: interactive investor Past performance is not a guide to future performance
There was one more down/up sequence but only back to the $360 area on 27 February. But then, as tech shares were aggressively sold in the past fortnight, support levels were breached and today, they are down to the $250 region.
That is a massive $110 gain in just a few weeks and was the result of a patient and deliberate strategy that culminated months of watching and waiting.
And my hunch that Tesla would fall faster than most other major tech shares has been borne out. Tesla is down a whopping 33% while Apple is only off 10%.
In a bear trend, it pays to go for the weakest companies that have the highest PE ratio - and some cases, an infinite one!
My main target is now the blue trendline in the $220 area.
These articles are provided for information purposes only. Occasionally, an opinion about whether to buy or sell a specific investment may be provided by third parties. The content is not intended to be a personal recommendation to buy or sell any financial instrument or product, or to adopt any investment strategy as it is not provided based on an assessment of your investing knowledge and experience, your financial situation or your investment objectives. The value of your investments, and the income derived from them, may go down as well as up. You may not get back all the money that you invest. The investments referred to in this article may not be suitable for all investors, and if in doubt, an investor should seek advice from a qualified investment adviser.
Full performance can be found on the company or index summary page on the interactive investor website. Simply click on the company's or index name highlighted in the article.
Disclosure
We use a combination of fundamental and technical analysis in forming our view as to the valuation and prospects of an investment. Where relevant we have set out those particular matters we think are important in the above article, but further detail can be found here.
Please note that our article on this investment should not be considered to be a regular publication.
Details of all recommendations issued by ii during the previous 12-month period can be found here.
ii adheres to a strict code of conduct. Contributors may hold shares or have other interests in companies included in these portfolios, which could create a conflict of interests. Contributors intending to write about any financial instruments in which they have an interest are required to disclose such interest to ii and in the article itself. ii will at all times consider whether such interest impairs the objectivity of the recommendation.
In addition, individuals involved in the production of investment articles are subject to a personal account dealing restriction, which prevents them from placing a transaction in the specified instrument(s) for a period before and for five working days after such publication. This is to avoid personal interests conflicting with the interests of the recipients of those investment articles.