Chart of the week: this major crash could be chance to buy cheaply
31st October 2022 12:19
by John Burford from interactive investor
Odds have now swung in favour of the bulls and analyst John Burford believes this well-respected company is excellent value for long-term investors.

Intel has crashed – is it now a buy?
The US big tech shares have been clobbered in recent weeks – and the mammoth computer chip-maker Intel Corp (NASDAQ:INTC) is no exception. Growth shares – investor darlings while interest rates were on the floor – started falling out of fashion big time when the Federal Reserve signalled that it was to begin raising interest rates last year as it was forced to follow the market yields up. Remember, the Fed follows the market – never leads.
- Read about: Free regular investing | ii Super 60 Investments | Cashback Offers
But the computer chip industry was particularly hit hard when supply snags appeared, leading to slower deliveries to car makers, which had to cut back production volumes. This led to long delivery times and produced the infamous inverse scenario where used models for instant delivery were priced higher than new orders with deliveries measured in months!
And Intel’s PC market has continued to weaken. All in all, a bleak picture.
And it got worse. Last week, the company reported an 83% decrease in Q3 net income from last year, adding insult to injury.
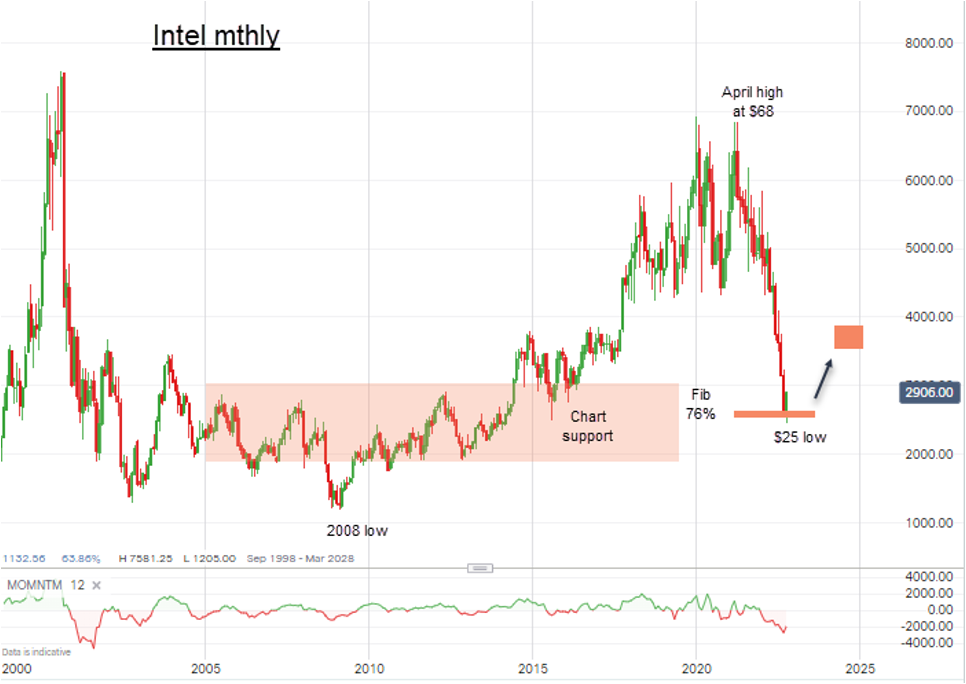
But to reflect this performance, the shares have collapsed from the $68 high in April to last week's $25 low. However, the dividend was maintained with the shares now paying at a juicy 5% rate.
So with a lot of bad news now out in the market, is this as bad as it is going to get? The company has plans to make major cuts to expenses and to bring back some production to its US home soil. That should boost the bottom line.
Turning to the chart, the low last week at $25 just prior to the late-week bounce took it to a precise hit on the Fibonacci 76% retrace of the entire rally off the 2008 credit crunch low! How about that for accuracy of Fibonacci targets?

Past performance is not a guide to future performance.
The boom-and-bust nature of the chip business has been well demonstrated by the almost vertical decline off the April high. But note the shaded pink zone from 2005 to 2015 where shares went nowhere. That is a zone of potential major support. And last week the shares dipped well inside it and, if it behaves as normal, it will provide a basis for a relief rally at some stage.
But has that stage been reached now? I cannot say, but the odds are now swinging away from the bear and towards the bull.
So, this well-respected leading chip company represents excellent value for long-term investors although keep in mind the lows may not have been reached just yet. Only a decline below the $20 mark would send me back to the drawing board.
John Burford is a freelance contributor and not a direct employee of interactive investor.
These articles are provided for information purposes only. Occasionally, an opinion about whether to buy or sell a specific investment may be provided by third parties. The content is not intended to be a personal recommendation to buy or sell any financial instrument or product, or to adopt any investment strategy as it is not provided based on an assessment of your investing knowledge and experience, your financial situation or your investment objectives. The value of your investments, and the income derived from them, may go down as well as up. You may not get back all the money that you invest. The investments referred to in this article may not be suitable for all investors, and if in doubt, an investor should seek advice from a qualified investment adviser.
Full performance can be found on the company or index summary page on the interactive investor website. Simply click on the company's or index name highlighted in the article.
Disclosure
We use a combination of fundamental and technical analysis in forming our view as to the valuation and prospects of an investment. Where relevant we have set out those particular matters we think are important in the above article, but further detail can be found here.
Please note that our article on this investment should not be considered to be a regular publication.
Details of all recommendations issued by ii during the previous 12-month period can be found here.
ii adheres to a strict code of conduct. Contributors may hold shares or have other interests in companies included in these portfolios, which could create a conflict of interests. Contributors intending to write about any financial instruments in which they have an interest are required to disclose such interest to ii and in the article itself. ii will at all times consider whether such interest impairs the objectivity of the recommendation.
In addition, individuals involved in the production of investment articles are subject to a personal account dealing restriction, which prevents them from placing a transaction in the specified instrument(s) for a period before and for five working days after such publication. This is to avoid personal interests conflicting with the interests of the recipients of those investment articles.