Chart of the week: A low-risk FTSE 100 trade
9th October 2017 11:47
by John Burford from interactive investor
Sky is under a cloud, but are the shares now a buy?
The proposed Sky takeover is still very much up in the air (sorry!) which is where the shares ascended to on the announcement back in December. But with the clouds over its referral to the Competition and Markets Authority, the shares have fallen back to earth somewhat. But regardless of the bid's success or not, can the shares still mount a rally?
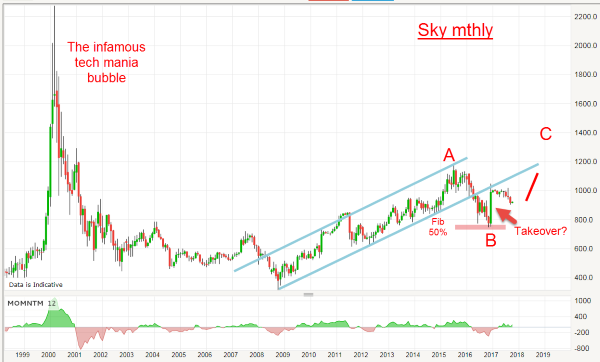
Here is the rather Everest-looking long range chart that shows the manic antics

That little episode encapsulates why I do not believe in the 'buy and hold' approach to investing (and certainly not to trading). Imagine buying the shares before 1999 at around £4, seeing them zoom up to the £20 area to give a magnificent 400% capital gain windfall within a few months – and then see them fall back to £4 again in 2009. That is a classic buy and hold failure.
If you are like me, then you would be a tad disappointed (unless you had a 20-year-plus horizon – and who has one that long?).
As the bubble burst, the shares headed south and only reached its low in the Credit Crunch wipe-out of 2009. Along with the general market, the shares began a steady recovery and made a high at the £12 area in July 2016 which I have labelled the A wave.
The decline off that A wave high is my wave B and took the shares to a Fibonacci 50% retrace of the A wave at the £7.50 level in December when the bid approach was made.
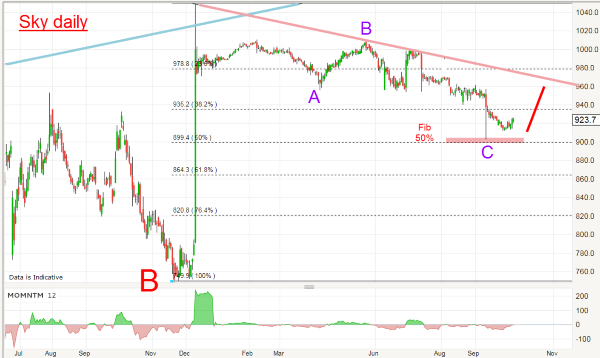
That bid sent the shares soaring to the £10.50 level in one day. As the very reasonable doubts over the success of the bid grew, the shares have drifted back to the current £9 region. Here is a close-up of the action this year:

There are several important points to note here. First, volatility has very much reduced with daily ranges much tighter than they were before the bid. This indicates lack of investor interest in buying or selling – and a potentially bullish sign, especially following this rather lengthy nine-month correction phase.
Second, the decline can be considered a corrective A-B-C with the C wave potentially ending at the Fibonacci 50% support level at £9 - a typical region where corrections to the main trend end.
The pink trendline is a line drawn off the £10.50 high and lies just above the next resistance level.
This presents us with a low risk trade because, if it fails, the risk to a stop-loss placed just under the £9 level is low. My first target is the pink trendline in the £9.60 area. And if this resistance can be overcome, I have a higher target in the £11-12 area on the underside of the lower tramline on the top chart.
But even if the shares have another dip in store, the next support level is the Fibonacci 62% at around £8.60 where a similar trade could be made.
Many traders/investors enter a trade without stop-loss protection. This is akin to believing their trade is a 'can't lose' proposition, such as a tip on a sure thing horse. Sadly, there is no such thing and all forecasts about the future must be looked at as probabilistic events.
One of the general rules of the markets is that when bullish sentiment towards an outcome becomes extreme, that is when it is wise to head for the doors – as the left-hand side of the top chart amply demonstrates. And when the market drifts and turns quiet – as here – upside 'surprises' often result.
This article is for information and discussion purposes only and does not form a recommendation to invest or otherwise. The value of an investment may fall. The investments referred to in this article may not be suitable for all investors, and if in doubt, an investor should seek advice from a qualified investment adviser.
These articles are provided for information purposes only. Occasionally, an opinion about whether to buy or sell a specific investment may be provided by third parties. The content is not intended to be a personal recommendation to buy or sell any financial instrument or product, or to adopt any investment strategy as it is not provided based on an assessment of your investing knowledge and experience, your financial situation or your investment objectives. The value of your investments, and the income derived from them, may go down as well as up. You may not get back all the money that you invest. The investments referred to in this article may not be suitable for all investors, and if in doubt, an investor should seek advice from a qualified investment adviser.
Full performance can be found on the company or index summary page on the interactive investor website. Simply click on the company's or index name highlighted in the article.
Disclosure
We use a combination of fundamental and technical analysis in forming our view as to the valuation and prospects of an investment. Where relevant we have set out those particular matters we think are important in the above article, but further detail can be found here.
Please note that our article on this investment should not be considered to be a regular publication.
Details of all recommendations issued by ii during the previous 12-month period can be found here.
ii adheres to a strict code of conduct. Contributors may hold shares or have other interests in companies included in these portfolios, which could create a conflict of interests. Contributors intending to write about any financial instruments in which they have an interest are required to disclose such interest to ii and in the article itself. ii will at all times consider whether such interest impairs the objectivity of the recommendation.
In addition, individuals involved in the production of investment articles are subject to a personal account dealing restriction, which prevents them from placing a transaction in the specified instrument(s) for a period before and for five working days after such publication. This is to avoid personal interests conflicting with the interests of the recipients of those investment articles.