Chart of the week: Lloyds Bank share price target
19th November 2018 11:16
by John Burford from interactive investor
With a strong track record of calling movements in Lloyds Bank's share price accurately, technical analyst John Burford tells us where he thinks they'll end up.

Lloyds is making new lows
With the shares plumbing new depths last week, I am tempted to mutter "Told you so" to the many bulls who have been fighting the solid downtrend for months.
As regular readers know, I have been bearish on the banks for a very long time. The basic reason is that with their huge holdings of sovereign debt (as well as vulnerable corporate and mortgage debt as rates rise), we are facing a devastating period of debt deflation. This remains the elephant in the room, but not for much longer.
Here's a bit of fun. Type "Inflation in 2019" into your favourite search engine and we get 175,000 results. Now type "Deflation in 2019" and guess how many results? I find precisely six (and I may be five of them!). That's a 30,000-to-one ratio. That's some elephant! Hmm.
On this basis, deflation is totally off the radar for almost all – and that is why I am taking the prospect most seriously. Remember my Rule of Thumb? When (almost) everyone believes something is certain, it rarely happens. As the late great trader Joe Granville said with modicum of tongue-in-cheek: "When it's obvious, it's obviously wrong".
One give-away sign that should urge caution when researching a share to buy is this: Is the vast majority of pundits bullish? Because if they are, that could indicate the bullish herd is too large and they are simply advocating following an existing - and ending - trend (the safest and laziest stance).
- Chart of the week: A big question for Lloyds Bank shareholders
- Chart of the week: Will Lloyds ever recover?
- Why Lloyds Bank shares are in danger
As I showed last time, when bullish sentiment becomes too extreme, that's when tops tend to occur – and becomes manna from heaven for the bears.
Maybe recent bulls have been seduced by the announcement that the company intends to double its share buy-back scheme next year to £2 billion. Yet the shares keep sinking. I have news – company finance directors herd like the rest of us (contrarians aside) and make strong bullish commitments at or near market tops. In fact, that is another bearish indicator I usefully monitor.
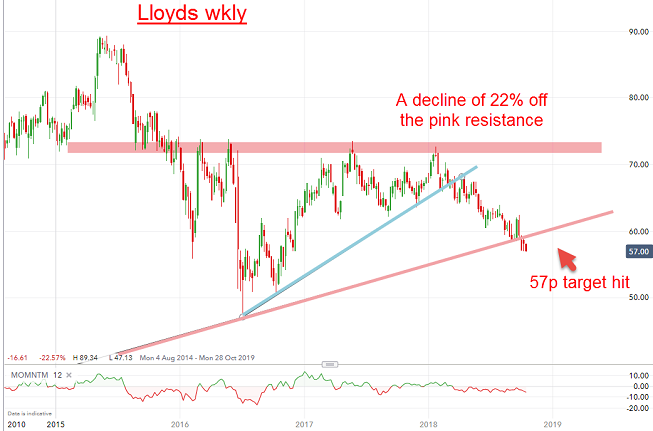
Here is the chart I showed last time on October 22 (Lloyds follows my roadmap to a T):

Source: interactive investor Past performance is not a guide to future performance
My long-standing 57p target had just been hit and the market was likely due a bounce of some sort. It had just broken the major long-term pink trendline thereby violating major support.
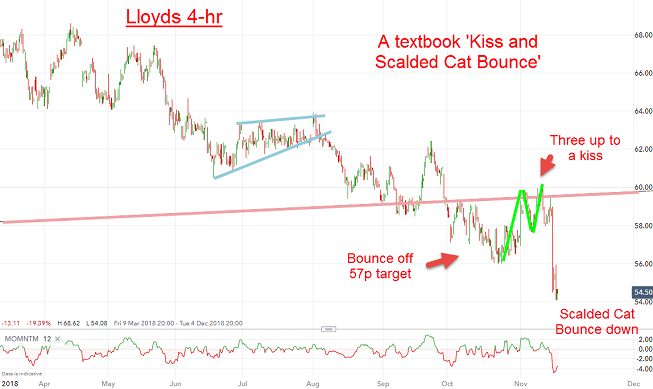
And into November, the shares did stage a counter-trend bounce – and that was another opportunity to either short or abandon long positions. Here is a close-up of recent action that shows one of my favourite chart patterns – a Kiss and Scalded Cat Bounce:

Source: interactive investor Past performance is not a guide to future performance
In this pattern, the market broke major support, then came back for a final kiss goodbye and hurriedly moved lower as the pink line has now become a major line of resistance.
I use the term Scalded Cat Bounce in an allusion to the more famous Dead Cat Bounce (that I mentioned last time). Here, the cat is not dead but very much alive as it escapes the hot water suddenly showering it by the market gods. Cats tend to move with velocity in this situation, as do markets.
I remain short and my next long-standing target is the July 2016 low at 46p.
For more information about Tramline Traders, or to take a three-week free trial, go to Tramline Traders.com.
John Burford is the author of the definitive text on his trading method, Tramline Trading. He is also a freelance contributor and not a direct employee of interactive investor.
These articles are provided for information purposes only. Occasionally, an opinion about whether to buy or sell a specific investment may be provided by third parties. The content is not intended to be a personal recommendation to buy or sell any financial instrument or product, or to adopt any investment strategy as it is not provided based on an assessment of your investing knowledge and experience, your financial situation or your investment objectives. The value of your investments, and the income derived from them, may go down as well as up. You may not get back all the money that you invest. The investments referred to in this article may not be suitable for all investors, and if in doubt, an investor should seek advice from a qualified investment adviser.
Full performance can be found on the company or index summary page on the interactive investor website. Simply click on the company's or index name highlighted in the article.
Disclosure
We use a combination of fundamental and technical analysis in forming our view as to the valuation and prospects of an investment. Where relevant we have set out those particular matters we think are important in the above article, but further detail can be found here.
Please note that our article on this investment should not be considered to be a regular publication.
Details of all recommendations issued by ii during the previous 12-month period can be found here.
ii adheres to a strict code of conduct. Contributors may hold shares or have other interests in companies included in these portfolios, which could create a conflict of interests. Contributors intending to write about any financial instruments in which they have an interest are required to disclose such interest to ii and in the article itself. ii will at all times consider whether such interest impairs the objectivity of the recommendation.
In addition, individuals involved in the production of investment articles are subject to a personal account dealing restriction, which prevents them from placing a transaction in the specified instrument(s) for a period before and for five working days after such publication. This is to avoid personal interests conflicting with the interests of the recipients of those investment articles.