Chart of the week: This incredible share could become a pariah
It's one of the best and most reliable investments, but the glory days could be over, argues our analyst.
7th October 2019 10:33
by John Burford from interactive investor
It's one of the best and most reliable investments, but the glory days could be over, argues our analyst.

Is it possible? Could one of the best and most reliable investments in the world become a pariah? Here, I will make the case for my very contrarian bearish view.
We all know that McDonald's (NYSE:MCD) sells beef hamburgers – lots of them. Latest figures put sales at 50 million a day. No need to ask where's the beef - it's under the Golden Arches!
Aiding the multi-decade growth of the company, western meat consumption per capita since 1930 has been steadily rising, but in a lovely Elliott wave in five sub-waves from a low in the 1930s at 100 lb per year to a high made in the late 1990s at about 220 lbs. But since the wave-5 high around 1998, per capita consumption has been in decline, and here are two recent headlines highlighting this fact:
Red meat consumption falls 15% over 10 years - Global Meat News 2018
41% of Americans ate less meat in past year - Food Navigator USA 2018
The initial decline could not have been due to the vegan/vegetarian movement since that has only recently emerged in the past year or so in any strength. Of course, McDonald's, which has always had a pretty reactive management team, have slowly adjusted their menus to account for the changing consumer tastes over the years. And that is why they recently announced the addition of vegan items using Beyond Meat products. Their arch-rival Burger King is already ahead in this game.
I am pretty sure that most managers of burger chains keep the said chart of meat consumption on their bathroom mirrors so they cannot miss being reminded of the downward trend – and the constant need to innovate.
Here is a chart of the growing mismatch of MCD share price and revenues that appear to reflect the declining meat consumption and perhaps increasing competition.
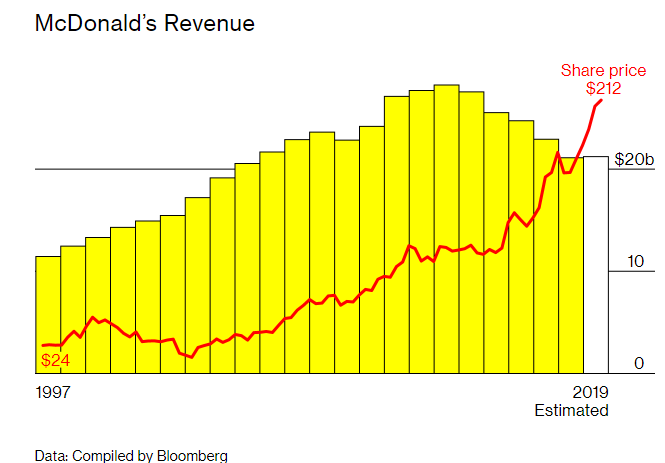
This divergence cannot be sustained. In any case, here is the weekly long-term chart:
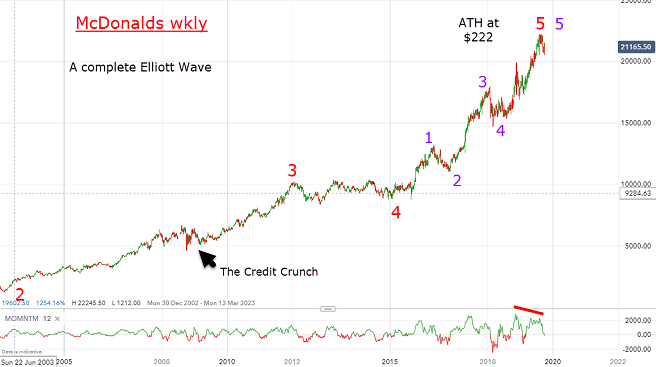
Source: interactive investor Past performance is not a guide to future performance
And under the Elliott wave model, odds are very high we have seen a major top at $222 set in mid-August.
I have two major five-wave impulsive patterns up to that high and on a momentum divergence. For a closer look, here is the daily:
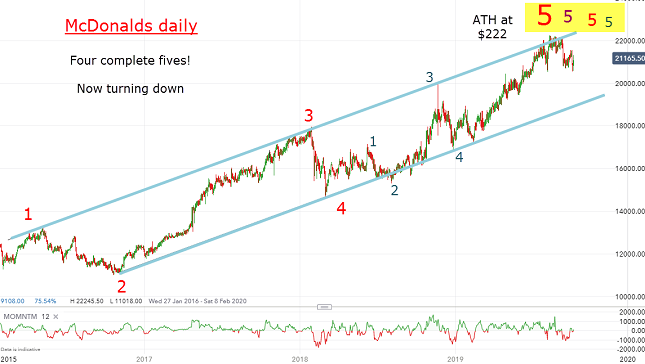
Source: interactive investor Past performance is not a guide to future performance
In fact, I now have four ending fifth waves terminating in August at the $222 level. And, as a bonus, this high sits directly on the upper tramline resistance and with a momentum divergence on the weekly. That makes the $222 high a high-probability long term top.
Putting all these factors together points to my bearish stance being of high probability. Long term investors could well look to engage in some profit-taking. Swing traders can start to look for short entries, with my first major target in the $150 region.
For more information about Tramline Traders, or to take a three-week free trial, go to www.tramlinetraders.com.
John Burford is the author of the definitive text on his trading method, Tramline Trading. He is also a freelance contributor and not a direct employee of interactive investor.
These articles are provided for information purposes only. Occasionally, an opinion about whether to buy or sell a specific investment may be provided by third parties. The content is not intended to be a personal recommendation to buy or sell any financial instrument or product, or to adopt any investment strategy as it is not provided based on an assessment of your investing knowledge and experience, your financial situation or your investment objectives. The value of your investments, and the income derived from them, may go down as well as up. You may not get back all the money that you invest. The investments referred to in this article may not be suitable for all investors, and if in doubt, an investor should seek advice from a qualified investment adviser.
Full performance can be found on the company or index summary page on the interactive investor website. Simply click on the company's or index name highlighted in the article.
Disclosure
We use a combination of fundamental and technical analysis in forming our view as to the valuation and prospects of an investment. Where relevant we have set out those particular matters we think are important in the above article, but further detail can be found here.
Please note that our article on this investment should not be considered to be a regular publication.
Details of all recommendations issued by ii during the previous 12-month period can be found here.
ii adheres to a strict code of conduct. Contributors may hold shares or have other interests in companies included in these portfolios, which could create a conflict of interests. Contributors intending to write about any financial instruments in which they have an interest are required to disclose such interest to ii and in the article itself. ii will at all times consider whether such interest impairs the objectivity of the recommendation.
In addition, individuals involved in the production of investment articles are subject to a personal account dealing restriction, which prevents them from placing a transaction in the specified instrument(s) for a period before and for five working days after such publication. This is to avoid personal interests conflicting with the interests of the recipients of those investment articles.