Chart of the week: An ideal setup for a short squeeze
2nd July 2018 10:31
by John Burford from interactive investor

Randgold - will it take off?
In my COTW early last month, I painted a potentially bullish scenario for this beaten-down gold miner, and it appears likely that it is about to materialise.
Since early June, gold has moved slightly lower as the dollar continued its advance. But, crucially, my £56 line-in-the-sand for my bullish case for Randgold Resources Ltd has held.
This is what I wrote in June:
"A break of the £56 low and a close below it would put a hold on this forecast but I do not see much more downside if that low probability event occurs."
- Chart of the week: Scene set for 'mammoth' rally phase at this blue chip
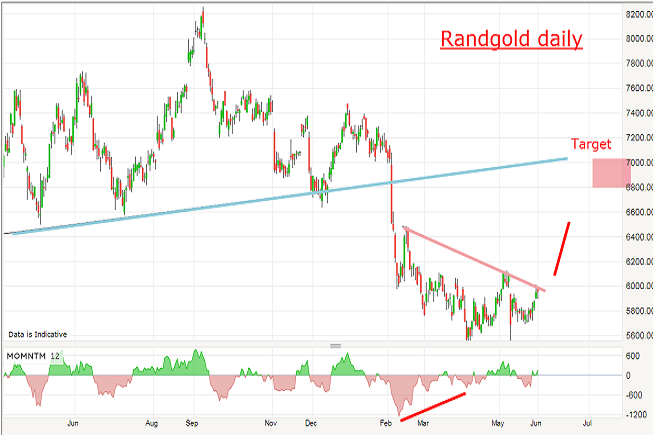
But to recap, this was the daily chart I showed last time:

Source: interactive investor Past performance is not a guide to future performance
The April low at £56 was made on a large momentum divergence, and because this area was at strong long-term support (see weekly chart last time), I reckoned that a break above the pink trendline would indicate that my forecasted rally phase was about to get under way.
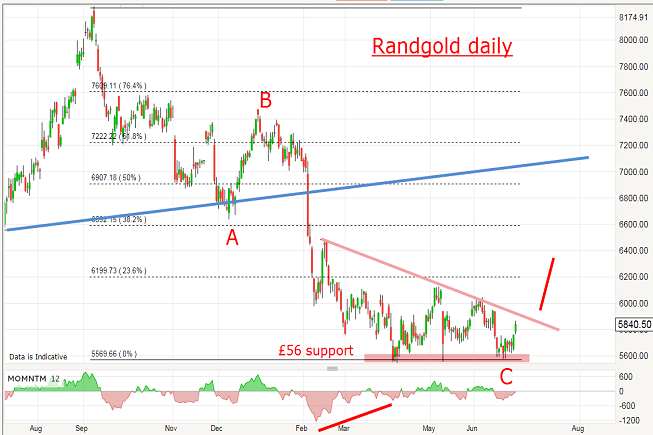
As is often the case in markets, there was another test of the £56 support to come later in the month. But, last week, the support has held and the market is poised to surge higher above the pink trendline:

Source: interactive investor Past performance is not a guide to future performance
Incidentally, the long-term support derives from the major low in December 2016 – 18 months ago. A nice demonstration that markets have long memories.
However, support zones can and are broken! It is no guarantee reversals can begin from there.
But if we see a surge upwards this week, I have my first target at the blue trendline in place. And, if my wave labels are correct, we should see a move up to possibly the old high at the £80 area.
In the near-term, my key level is the pink trendline in the £59-60 area.
There is one important tailwind in that bullish percent sentiment in gold has fallen into single figures, which is near an historic extreme. Gold traders are massively short the metal futures – and this is an ideal setup for a short squeeze, and a means for Randgold to rally.
John Burford is the author of the definitive text on his trading method, Tramline Trading. He is also a freelance contributor and not a direct employee of interactive investor.
These articles are provided for information purposes only. Occasionally, an opinion about whether to buy or sell a specific investment may be provided by third parties. The content is not intended to be a personal recommendation to buy or sell any financial instrument or product, or to adopt any investment strategy as it is not provided based on an assessment of your investing knowledge and experience, your financial situation or your investment objectives. The value of your investments, and the income derived from them, may go down as well as up. You may not get back all the money that you invest. The investments referred to in this article may not be suitable for all investors, and if in doubt, an investor should seek advice from a qualified investment adviser.
Full performance can be found on the company or index summary page on the interactive investor website. Simply click on the company's or index name highlighted in the article.