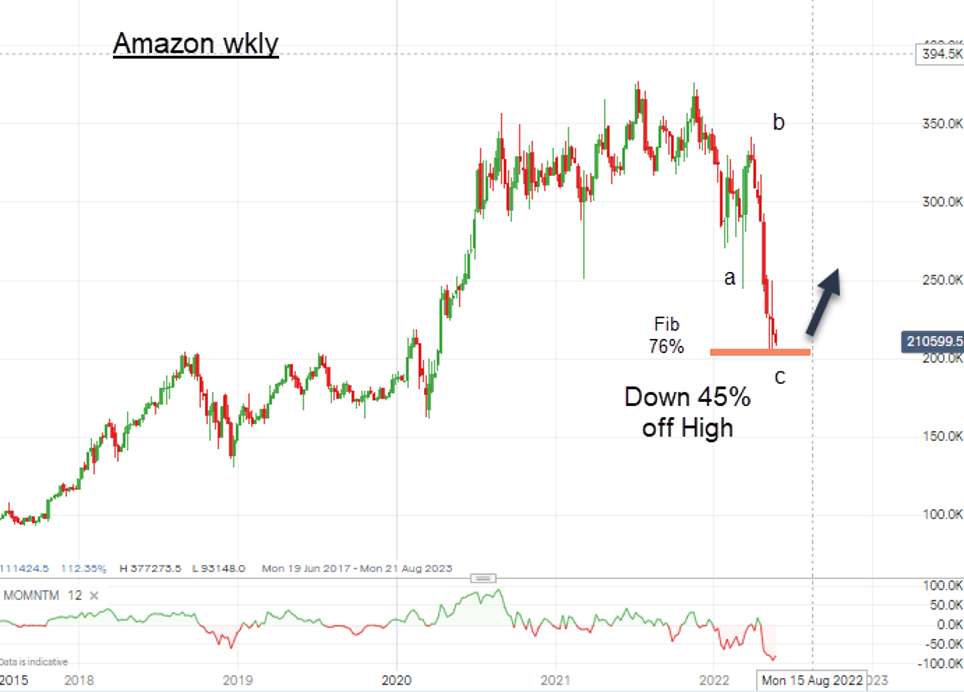
Chart of the week: how to buy Amazon shares at a massive discount
24th May 2022 12:25
by John Burford from interactive investor
With the shares down significantly from their record high and a stock split imminent, technical analyst John Burford explains his view of the retail colossus.

Amazon is offered at a 45% discount – buy?
Along with every US tech share, Amazon.com (NASDAQ:AMZN) has been literally clobbered in recent weeks. From the all-time high at $3,750 set in July last year, it has lost 45% to the recent low at $2,050. And last year, this was supposed to be one of the 'never sell' shares along with others in the tech sector’s FAANG gang.
But its most recent slide was accompanied by dire news last week of weak US retail sales data. That data hammered such retail giants as the low-to medium discount retailer Target (NYSE:TGT). It suffered a huge air pocket last Wednesday when its shares gapped lower by a massive 25% on the release of its Q1 earnings and sales report.
- Target and Walmart shock hammers Tesco, Diageo and Unilever
- Scottish Mortgage tops up Moderna, trims Amazon and sticks by Netflix
- Insider: Amazon slowdown is chance to buy this UK mid-cap cheap
Many are now calling for a recession later this year as the outlook for big spending by the US consumer appears to be off the table – in spades. Not only that but the list of economic negatives is long, from the cost-of-living squeeze to the food crisis to rising interest rates. Who would dare buy shares in this bearish environment?
Putting Amazon shares under the microscope
So let's take a look at Amazon. A case can certainly be made for buying given the 45% bargain-basement discount on offer, its still dominant position in e-commerce and the 3 June 10-for-1 stock split together with its growing cloud computing division.
And in the wings, the company is working on several innovations, such as cashier-less retail stores (they are coming) and satellite broadband delivery, both of which could impact earnings down the road.
But near term, market sentiment is decidedly bearish and, with lagging sales growth, the company that was formerly hiring in droves is now looking to lay off workers in some regions.

Past performance is not a guide to future performance.
Yes, the chart is not a pretty sight, but the decline looks like a three down (corrective) and is trading around a Fibonacci 76% retrace from the all-time high. It is now ploughing into major chart support from the late 2019–early 2020 period.
- How Terry Smith is investing as markets crash
- Why reading charts can help you become a better investor
With the huge discounts available on the big name US tech shares, insiders (corporate executives) now appear to be buying back the shares they sold late last year near the highs. Should you join them?
The upcoming stock split could provide a normal boost which could set a near-term low. However, if the general market fails to stop the slide, the shares could move somewhat lower before stabilising. But on a long-term view, Amazon at a 45% discount is very attractive.
John Burford is a freelance contributor and not a direct employee of interactive investor.
These articles are provided for information purposes only. Occasionally, an opinion about whether to buy or sell a specific investment may be provided by third parties. The content is not intended to be a personal recommendation to buy or sell any financial instrument or product, or to adopt any investment strategy as it is not provided based on an assessment of your investing knowledge and experience, your financial situation or your investment objectives. The value of your investments, and the income derived from them, may go down as well as up. You may not get back all the money that you invest. The investments referred to in this article may not be suitable for all investors, and if in doubt, an investor should seek advice from a qualified investment adviser.
Full performance can be found on the company or index summary page on the interactive investor website. Simply click on the company's or index name highlighted in the article.
Disclosure
We use a combination of fundamental and technical analysis in forming our view as to the valuation and prospects of an investment. Where relevant we have set out those particular matters we think are important in the above article, but further detail can be found here.
Please note that our article on this investment should not be considered to be a regular publication.
Details of all recommendations issued by ii during the previous 12-month period can be found here.
ii adheres to a strict code of conduct. Contributors may hold shares or have other interests in companies included in these portfolios, which could create a conflict of interests. Contributors intending to write about any financial instruments in which they have an interest are required to disclose such interest to ii and in the article itself. ii will at all times consider whether such interest impairs the objectivity of the recommendation.
In addition, individuals involved in the production of investment articles are subject to a personal account dealing restriction, which prevents them from placing a transaction in the specified instrument(s) for a period before and for five working days after such publication. This is to avoid personal interests conflicting with the interests of the recipients of those investment articles.