Chart of the week: The bull case for Metro Bank shares
Sentiment is at rock bottom, which makes it a possible candidate for this successful analyst's list.
29th July 2019 11:43
by John Burford from interactive investor
Sentiment is at rock bottom, which makes it a possible prime candidate for this successful analyst's Buy Low/Sell High list.

Metro Bank has few friends – and that's why I like it!
What a sorry story this is! Metro Bank (LSE:MTRO) launched in 2010 was billed as the first new High Street UK bank to appear in many years – and was set to shake up the cosy banking 'cartel' of the usual suspects. And its timing appeared perfect as memories of the 2007/2008 Credit Crunch bail-out of the 'too big to fail' majors were fresh in the mind.
Well, the only thing that was shaken up was the shareholders who have seen the share value plummet from the 400p high in March 2018 to last week's low under 40p for a staggering loss of 90%. That is some shake-up!
The bank's woes have been well reported and its shares were one of the most shorted on the London Stock Exchange. And last week they plunged another 20% on Thursday following poor results.
Virtually no pundit now has a good word to say for Metro Bank, with most advising either selling up or avoiding. Sentiment is at rock bottom – and that makes it a possible prime candidate for my Buy Low/Sell High list.
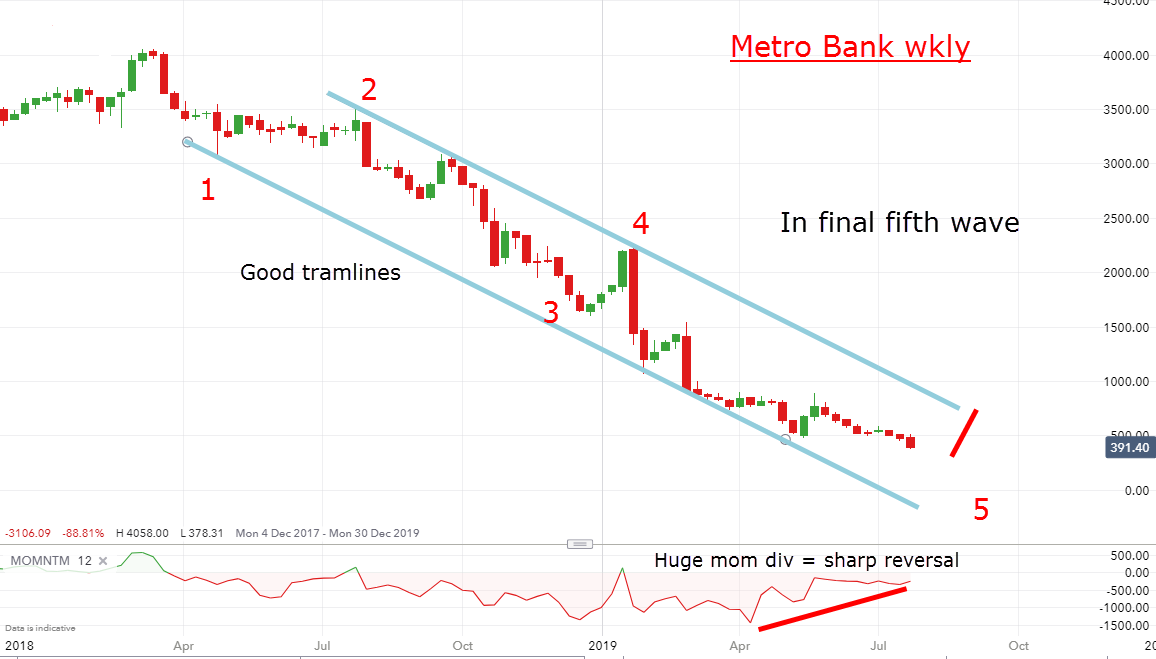
But to determine its suitability, I go to the all-important charts (as ever). Here is the weekly long-term picture:

Source: interactive investor Past performance is not a guide to future performance
The 90% collapse in the share price is travelling along my very tidy tramline pair and in five waves, with the market currently in the final fifth wave (that may not have ended).
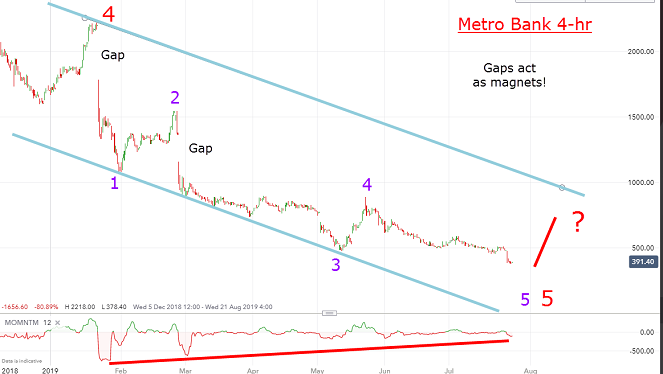
And note the huge momentum divergence in place which indicates selling pressure is rapidly drying up. This is getting interesting!So, let’s now focus on the fifth wave on the 4-hour chart:

Source: interactive investor Past performance is not a guide to future performance
And this wave also sports a five-wave structure with the current market in the final wave 5 of 5. And I have a very large momentum divergence on this scale, too. Hmm.
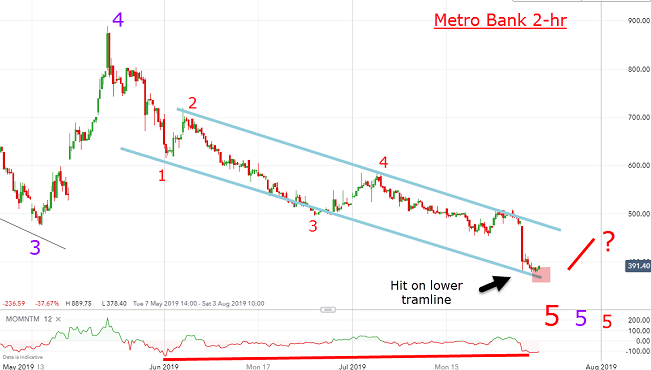
So, let's finally close in on that purple fifth wave on the 2-hour chart for further clues:

Source: interactive investor Past performance is not a guide to future performance
And, once again, I have a pretty tramline pair working, with this fifth wave also breaking down into a smaller five wave pattern. The market is currently in its fifth wave, placing it in wave 5 of 5 of 5. And that terminal position sets up a potentially very strong base to support a vigorous rally.
Combining that with the crucial support from the lower tramline, and the momentum divergence on all three scales, I have a very strong bullish case. In addition, the hedge fund shorts should be wondering if there is any more downside to squeeze out given the 90% collapse.
If I am right, we should see a rally to the 500p area and then a possible assault on the 2,000p resistance to attack the upper gap. And since large gaps usually get filled in eventually, will that process start from around here?
The danger is if the shares continue their collapse near term to well below the 350p level that would cancel out my analysis. But I set these odds much lower.
For more information about Tramline Traders, or to take a three-week free trial, go to www.tramlinetraders.com.
John Burford is the author of the definitive text on his trading method, Tramline Trading. He is also a freelance contributor and not a direct employee of interactive investor.
These articles are provided for information purposes only. Occasionally, an opinion about whether to buy or sell a specific investment may be provided by third parties. The content is not intended to be a personal recommendation to buy or sell any financial instrument or product, or to adopt any investment strategy as it is not provided based on an assessment of your investing knowledge and experience, your financial situation or your investment objectives. The value of your investments, and the income derived from them, may go down as well as up. You may not get back all the money that you invest. The investments referred to in this article may not be suitable for all investors, and if in doubt, an investor should seek advice from a qualified investment adviser.
Full performance can be found on the company or index summary page on the interactive investor website. Simply click on the company's or index name highlighted in the article.
Disclosure
We use a combination of fundamental and technical analysis in forming our view as to the valuation and prospects of an investment. Where relevant we have set out those particular matters we think are important in the above article, but further detail can be found here.
Please note that our article on this investment should not be considered to be a regular publication.
Details of all recommendations issued by ii during the previous 12-month period can be found here.
ii adheres to a strict code of conduct. Contributors may hold shares or have other interests in companies included in these portfolios, which could create a conflict of interests. Contributors intending to write about any financial instruments in which they have an interest are required to disclose such interest to ii and in the article itself. ii will at all times consider whether such interest impairs the objectivity of the recommendation.
In addition, individuals involved in the production of investment articles are subject to a personal account dealing restriction, which prevents them from placing a transaction in the specified instrument(s) for a period before and for five working days after such publication. This is to avoid personal interests conflicting with the interests of the recipients of those investment articles.