Chart of the week: Barclays shares could do this next
This lesson in economics gives us a big clue which way high street bank shares may be heading.
18th May 2020 10:38
by John Burford from interactive investor
This lesson in economics gives us a big clue which way high street bank shares may be heading.

Barclays remains in downtrend
When major bank shares are weak, as they are, it is a reflection of the state of the economy. When the economy grows, demand for loans is strong and bank earnings improve and vice versa.
It is a curious fact that many pundits are now expecting inflation and some even expect hyperinflation as central banks are creating even easier money than during their quantitative easing (QE) episodes. And they reckon goods and services will be in shorter supply now with the current pandemic shutting producers’ operations. So, more money chasing fewer goods/services = higher prices.
Sounds right, doesn’t it? They point to the surging gold price as evidence inflation is here - after all, isn’t gold a traditional hedge against inflation?
But, if this is true, why are bank shares at or near multi-year lows? And crude oil – that most critical indicator of inflation/deflation – also at multi-year lows?
Actually, the term ‘inflation’ is used very loosely today – even by those who should know better: economists. As is its opposite – deflation. Commonly, it means a general rise in prices (inflation) or a decline (deflation).
But these are simply by-products of what inflation/deflation actually is. I believe the evidence points clearly to the global economy entering a period of deflation, which is a period where the desire and ability of people to lend and borrow is diminishing. And, when that happens, prices generally trend lower, which is what we are seeing today. Recent Producer Price Index (PPI) and Consumer Price Index (CPI) data certainly confirm that.
And with a reduction in loan volumes, bank shares decline, which is also what we are seeing – and have done for years.
- Barclays shares surge to one-month high
- Aston Martin: should you buy the shares at this level?
- Chart of week: Barclays vs Deutsche Bank
Getting back to Barclays (LSE:BARC), it made its all-time high in 2007 at £7.75, and has been in a solid bear trend since then, reaching a low of 73p in March. So what does that tell you about the underlying state of the UK economy?
If it were not for the desperate government schemes to prop up the housing market, among others, relatively free-market market forces would have pricked that bubble years ago.
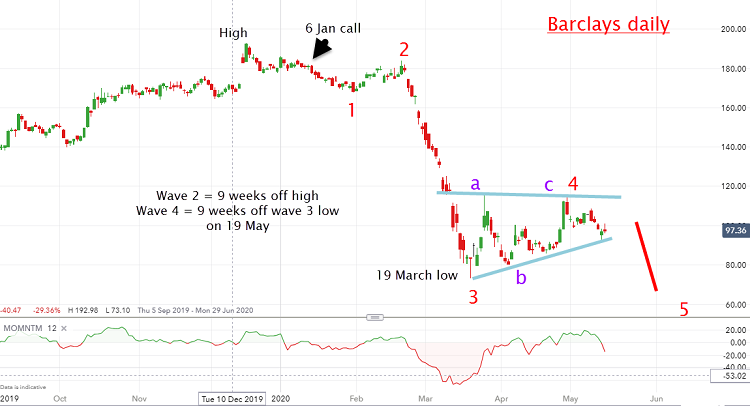
Here is the latest share chart:

Source: interactive investor. Past performance is not a guide to future performance.
I last covered Barclays on 6 January, just before the Corona Crash, which I have labelled wave 3 to the 19 March low. The recovery since then has been relatively weak compared with the relief rally in the FTSE 100 – and has a textbook form of an a-b-c triangle.
My forecast is for a new wave 5 below the wave 3 low at 73p. Then, odds favour a very strong rally phase that should be tradable. I will try to identify the turning points.
For more information about Tramline Traders, or to take a three-week free trial, go to www.tramlinetraders.com.
John Burford is the author of the definitive text on his trading method, Tramline Trading. He is also a freelance contributor and not a direct employee of interactive investor.
These articles are provided for information purposes only. Occasionally, an opinion about whether to buy or sell a specific investment may be provided by third parties. The content is not intended to be a personal recommendation to buy or sell any financial instrument or product, or to adopt any investment strategy as it is not provided based on an assessment of your investing knowledge and experience, your financial situation or your investment objectives. The value of your investments, and the income derived from them, may go down as well as up. You may not get back all the money that you invest. The investments referred to in this article may not be suitable for all investors, and if in doubt, an investor should seek advice from a qualified investment adviser.
Full performance can be found on the company or index summary page on the interactive investor website. Simply click on the company's or index name highlighted in the article.
Disclosure
We use a combination of fundamental and technical analysis in forming our view as to the valuation and prospects of an investment. Where relevant we have set out those particular matters we think are important in the above article, but further detail can be found here.
Please note that our article on this investment should not be considered to be a regular publication.
Details of all recommendations issued by ii during the previous 12-month period can be found here.
ii adheres to a strict code of conduct. Contributors may hold shares or have other interests in companies included in these portfolios, which could create a conflict of interests. Contributors intending to write about any financial instruments in which they have an interest are required to disclose such interest to ii and in the article itself. ii will at all times consider whether such interest impairs the objectivity of the recommendation.
In addition, individuals involved in the production of investment articles are subject to a personal account dealing restriction, which prevents them from placing a transaction in the specified instrument(s) for a period before and for five working days after such publication. This is to avoid personal interests conflicting with the interests of the recipients of those investment articles.