Chart of the week: are BP shares a buy at this level?
28th February 2022 12:58
by John Burford from interactive investor
After deciding to jettison its interest in Rosneft, BP shares fell sharply. Here’s what technical analyst John Burford thinks of the oil major’s prospects now.

Over the weekend, the real and the financial worlds have been rocked with Vladimir Putin invoking the nuclear option (squarely aimed at the West and not so much at Ukraine). And with Russian sanctions being stepped up sharply, financial institutions have been ordered to divest any Russian assets they own – and that includes BP (LSE:BP.)'s large stake in the huge Russian state-owned Rosneft (LSE:ROSN) company worth about £12 billion.
- BP’s $25bn decision to cut Rosneft ties
- The funds, investment trusts and ETFs with exposure to Russia\
- 27 dividend stocks for income seekers in 2022
The knee-jerk reaction Monday morning was to mark BP's share price lower (contrarily as crude oil surged). But has this thrown up another buy-the-dip opportunity for BP, which is the sister company of Shell (LSE:SHEL) that has just announced it will raise its dividend this quarter?
After all, oil prices remain in a strong uptrend and profits remain robust.
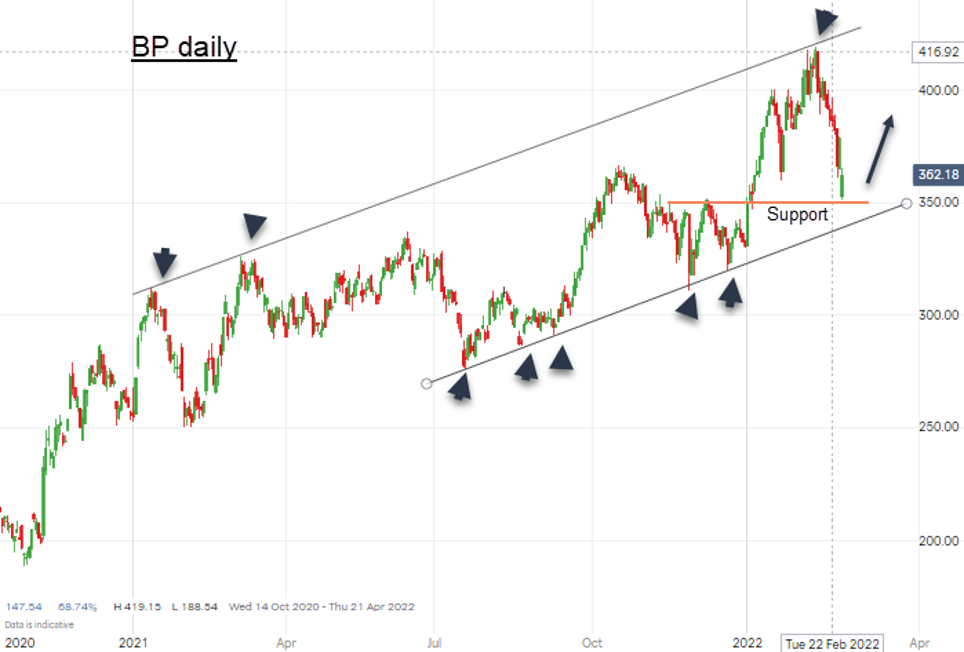
Here is the very fascinating daily chart:

Past performance is not a guide to future performance.
On 11 February, BP shares made a high in the 420p area and began a correction. I was then about to draw a line joining the three major highs (upper arrows). I now have a solid line of resistance into the future. With the three accurate touch points, I could then draw a parallel line and noted the multiple accurate touch points on the line beneath (five lower arrows).
With five touch points, I now have a solid line of support into the future.
Isn't that remarkable? Why should a parallel line confirm so precisely to one above? I have not drawn these lines at random - the market has decided where they should be placed.
- The financial impact of the Russia/Ukraine conflict
- Check out our award-winning stocks and shares ISA
That sets my fail-safe level for any further corrections at the 330-340p zone (currently 353p).
I have thus set out my roadmap: if the shares decline into the 330-340p zone, I will take that as a failure of the bull model and lighten up positions. That failure would be either temporary or permanent – there is no way of accurately judging this in advance (although we may have views).
But if the current level holds, I expect the old high at 420p to be reached and likely exceeded. Therefore, I have a reward/risk ratio for a long trade at about 3/1. That is acceptable.
- Stockwatch: a defensive play for worrying times
- Friends & Family: ii customers can give up to 5 people a free subscription to ii, for just £5 a month extra. Learn more
Of course, much will depend on the future course of oil prices and the state of the global economy. Most sober reviews of the global energy outlook call for an increase in fossil fuel use which BP is well positioned to supply.
If only it was that simple! Many institutions already have a policy of divesting their fossil fuel investments, including BP, and the current Russia sanctions have only magnified that urge.
But at current levels, BP is a buy.
John Burford is a freelance contributor and not a direct employee of interactive investor.
These articles are provided for information purposes only. Occasionally, an opinion about whether to buy or sell a specific investment may be provided by third parties. The content is not intended to be a personal recommendation to buy or sell any financial instrument or product, or to adopt any investment strategy as it is not provided based on an assessment of your investing knowledge and experience, your financial situation or your investment objectives. The value of your investments, and the income derived from them, may go down as well as up. You may not get back all the money that you invest. The investments referred to in this article may not be suitable for all investors, and if in doubt, an investor should seek advice from a qualified investment adviser.
Full performance can be found on the company or index summary page on the interactive investor website. Simply click on the company's or index name highlighted in the article.
Disclosure
We use a combination of fundamental and technical analysis in forming our view as to the valuation and prospects of an investment. Where relevant we have set out those particular matters we think are important in the above article, but further detail can be found here.
Please note that our article on this investment should not be considered to be a regular publication.
Details of all recommendations issued by ii during the previous 12-month period can be found here.
ii adheres to a strict code of conduct. Contributors may hold shares or have other interests in companies included in these portfolios, which could create a conflict of interests. Contributors intending to write about any financial instruments in which they have an interest are required to disclose such interest to ii and in the article itself. ii will at all times consider whether such interest impairs the objectivity of the recommendation.
In addition, individuals involved in the production of investment articles are subject to a personal account dealing restriction, which prevents them from placing a transaction in the specified instrument(s) for a period before and for five working days after such publication. This is to avoid personal interests conflicting with the interests of the recipients of those investment articles.