Chart of the week: are bombed-out easyJet shares now a buy?
4th July 2022 12:39
by John Burford from interactive investor
The market has satisfied all requirements for easyJet shares to stage a counter-trend rally phase. Technical analyst John Burford explains what that might mean for the share price.

As the highly negative effects of the pandemic lockdowns that grounded flights since early 2020 were easing, there was hope that the travel industry could get back on its feet. But not so. The recent well-publicised flight cancellations and airport scenes of chaos has dealt it another blow.
The shares of easyJet (LSE:EZJ) have crashed as operating losses have mounted. But have they discounted all or most of the bad news? After all, how much worse can conditions get?
- Shares for the future: 25 shares I think are good value right now
- FIRE movement exposed: is it really possible to retire at 40?
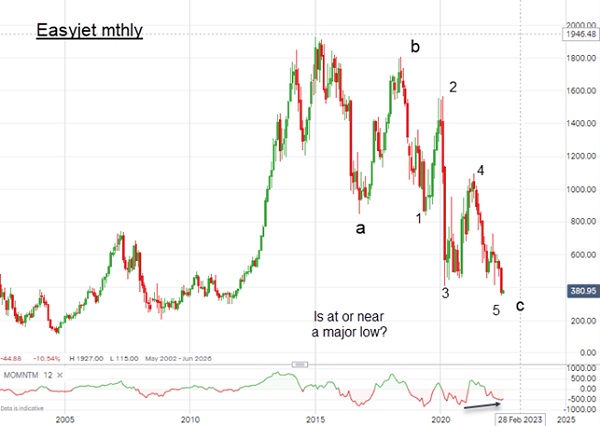
This is the disaster story on the long-term monthly chart. From highs of around £18 to the current £3.70 area, they have fallen off a cliff by a staggering 80%.
So here is my bullish case:

Past performance is not a guide to future performance.
There are a couple of notable features to this chart. First, the entire decline appears to be a three down in an a-b-c. That is a corrective pattern to the main major uptrend.
Second, the 'c' wave is in a clear five-wave 'ending diagonal' pattern with overlapping waves (the wave 4 high is higher than the wave 1 low). With the new low just made in wave 5, the market has satisfied all requirements to stage a counter-trend rally phase.
- ii view: easyJet cuts summer flights as it battles staff shortages
- What an inflation shock really looks like
- Why reading charts can help you become a better investor
Third, there is a good momentum divergence between waves 5 and 3. This indicates the selling pressure is easing into the new lows as buyers start to take control. This momentum divergence is particularly strong when viewed on the daily and weekly charts.
And fourth, the market has entered massive chart support from the 2004-2012 period. It would take a great deal of selling pressure to break below that.
Consider we are approaching the height of the holiday travel season when the industry must be pulling out all the stops to solve the well-known staffing and pilot problems to reduce the cancellation rate.
Also, aviation fuel prices seem to be easing off their highs (US gasoline prices are 18% off) and, if they fall further, that would help reduce operating costs.
So, is there light at the end of the runway? I believe so, and the shares should be at or very near a major low. My first target is around £8.50 with higher potential.
John Burford is a freelance contributor and not a direct employee of interactive investor.
These articles are provided for information purposes only. Occasionally, an opinion about whether to buy or sell a specific investment may be provided by third parties. The content is not intended to be a personal recommendation to buy or sell any financial instrument or product, or to adopt any investment strategy as it is not provided based on an assessment of your investing knowledge and experience, your financial situation or your investment objectives. The value of your investments, and the income derived from them, may go down as well as up. You may not get back all the money that you invest. The investments referred to in this article may not be suitable for all investors, and if in doubt, an investor should seek advice from a qualified investment adviser.
Full performance can be found on the company or index summary page on the interactive investor website. Simply click on the company's or index name highlighted in the article.
Disclosure
We use a combination of fundamental and technical analysis in forming our view as to the valuation and prospects of an investment. Where relevant we have set out those particular matters we think are important in the above article, but further detail can be found here.
Please note that our article on this investment should not be considered to be a regular publication.
Details of all recommendations issued by ii during the previous 12-month period can be found here.
ii adheres to a strict code of conduct. Contributors may hold shares or have other interests in companies included in these portfolios, which could create a conflict of interests. Contributors intending to write about any financial instruments in which they have an interest are required to disclose such interest to ii and in the article itself. ii will at all times consider whether such interest impairs the objectivity of the recommendation.
In addition, individuals involved in the production of investment articles are subject to a personal account dealing restriction, which prevents them from placing a transaction in the specified instrument(s) for a period before and for five working days after such publication. This is to avoid personal interests conflicting with the interests of the recipients of those investment articles.