Chart of the week: is Apple falling from the tree?
29th November 2021 12:32
by John Burford from interactive investor
A 'buying climax' may have happened at the tech giant, and this technical analyst has major doubts. He also has an update on other FAANG stocks and market moves on Monday.

With the new Omicron Covid-19 variant suddenly casting a dark-ish spectre over markets, I am making a case again that this most popular of shares has made a major long-term top and is trending lower.
Taking profits in Apple (NASDAQ:AAPL) is a prudent strategy, I believe, as I suggested earlier in my COTW of 20 September.
Of course, making such a prediction on the famous company that produces such well-loved consumer electronic products as Apple is fraught. And it has been a very profitable holding for many early investors. But, like the Christmas turkey, I am sticking my neck well and truly out.
- Read more articles by John Burford here
- Examine our six-part series on charting for beginners
- The Chart Show: Zoom, AO World, IAG
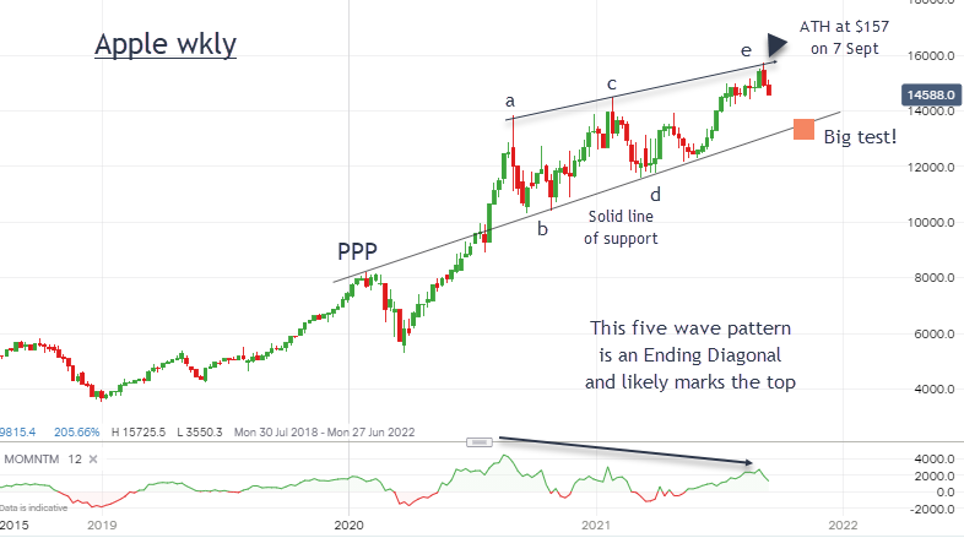
I made my first bearish/neutral case for Apple shares in my COTW of 20 September, when the shares were trading around the $150 area and had just made a very accurate hit on a major target of resistance. This was the chart I showed then:

Past performance is not a guide to future performance.
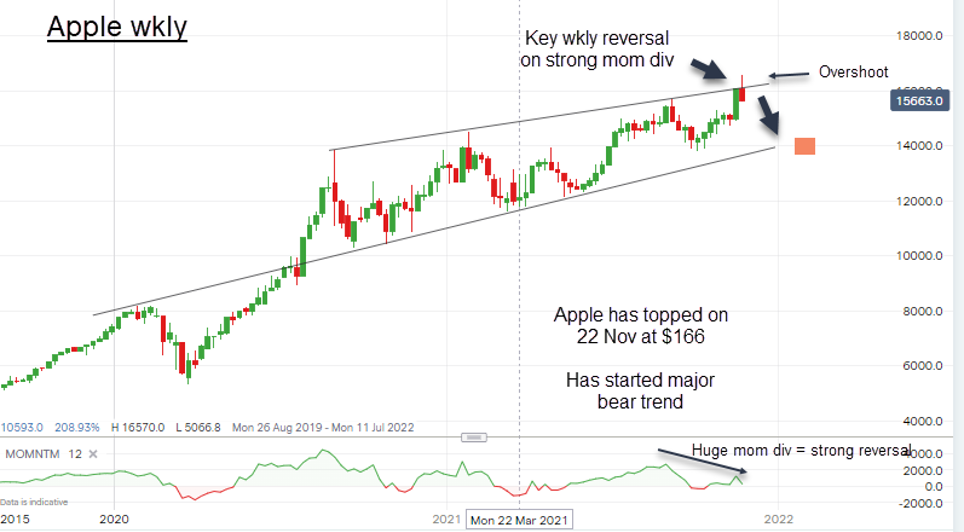
Since markets are always full of surprises, the shares have been teasing the bears and rallied a little further, making a high of $166 on 22 November as it posted record revenue for Q4 in September.
But that enthusiasm didn't last long as the shares rapidly reversed course off the high and has made a textbook example of what I call a 'buying climax' in the form of an 'overshoot'. This is when the market, after a lengthy bull trend, briefly pokes above a major line of resistance and rapidly moves back down below it. It is as if it wakes up and suddenly realises it shouldn't be there!
Here is the chart updated to the Friday close:

Past performance is not a guide to future performance.
It managed to poke above my upper major trendline of resistance and closed last week on a 'key reversal', which often appears at the end of a major run. Not only that, but the $166 high was set on a strong momentum divergence that continued my weak rally theme from September. That divergence should ensure the decline will be rapid.
Only a strong move above the $166 high would send me back to the drawing board.
The FAANG Gang
Apple is a member of what I call the FAANG Gang (Facebook/Meta (NASDAQ:FB), Apple, Netflix (NASDAQ:NFLX) and Google/Alphabet (NASDAQ:GOOGL)) which are the mega-cap tech leaders of US stock markets along with Amazon (NASDAQ:AMZN). For years, they have attracted the vast majority of investor interest as they are seen as actually benefiting from the pandemic lockdowns - and profit margins are huge.
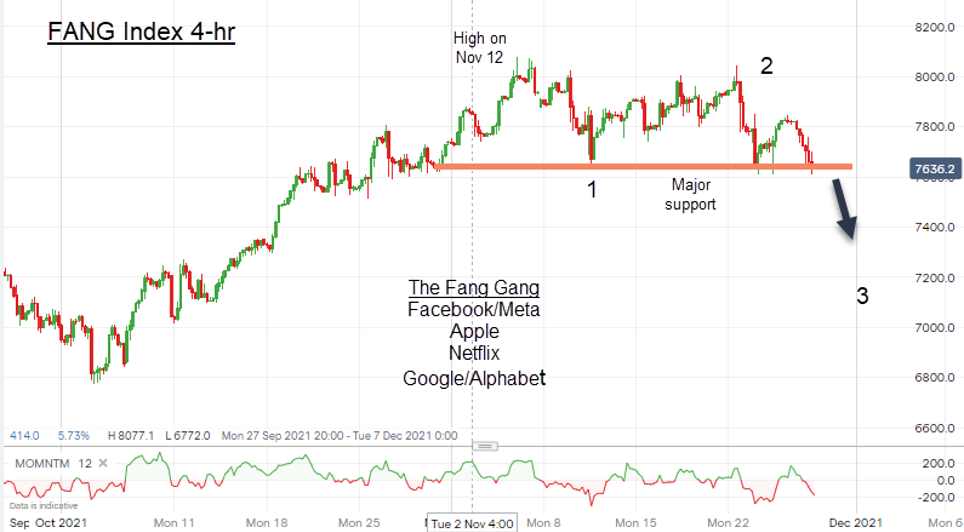
Here is an interesting chart of the group:

Past performance is not a guide to future performance.
It made its high on 12 November and is currently down 5% and is testing the major shelf of support. A sharp break of that would likely send it down to the next level of support at the 7,420 region (currently 7,620). That would imply a move in Apple down to $150.
Update Monday morning
Markets are rebounding strongly as first indications seem to imply that disruptions caused by the new variant will be less severe than last time during the corona crash.
Several global indexes including the FTSE 100 have made a Fibonacci 50% correction over the weekend to last week's plunge. That is impressive and typical in this market that has become highly emotional. Many large swings will now be driven by the reaction to rolling Omicron (and Delta) news.
It is interesting that this morning, as the Dow is up 600 points, London Stock Exchange holiday shares TUI (LSE:TUI) and easyJet (LSE:EZJ) have barely moved off their Friday lows. It seems they are not buying the same story as US investors. Hmm.
John Burford is the author of the definitive text on his trading method, Tramline Trading. He is also a freelance contributor and not a direct employee of interactive investor.
These articles are provided for information purposes only. Occasionally, an opinion about whether to buy or sell a specific investment may be provided by third parties. The content is not intended to be a personal recommendation to buy or sell any financial instrument or product, or to adopt any investment strategy as it is not provided based on an assessment of your investing knowledge and experience, your financial situation or your investment objectives. The value of your investments, and the income derived from them, may go down as well as up. You may not get back all the money that you invest. The investments referred to in this article may not be suitable for all investors, and if in doubt, an investor should seek advice from a qualified investment adviser.
Full performance can be found on the company or index summary page on the interactive investor website. Simply click on the company's or index name highlighted in the article.
Disclosure
We use a combination of fundamental and technical analysis in forming our view as to the valuation and prospects of an investment. Where relevant we have set out those particular matters we think are important in the above article, but further detail can be found here.
Please note that our article on this investment should not be considered to be a regular publication.
Details of all recommendations issued by ii during the previous 12-month period can be found here.
ii adheres to a strict code of conduct. Contributors may hold shares or have other interests in companies included in these portfolios, which could create a conflict of interests. Contributors intending to write about any financial instruments in which they have an interest are required to disclose such interest to ii and in the article itself. ii will at all times consider whether such interest impairs the objectivity of the recommendation.
In addition, individuals involved in the production of investment articles are subject to a personal account dealing restriction, which prevents them from placing a transaction in the specified instrument(s) for a period before and for five working days after such publication. This is to avoid personal interests conflicting with the interests of the recipients of those investment articles.