Chart of the week: Another buy signal for this share
25th September 2017 11:39
by John Burford from interactive investor
Accor powers ahead
is a member of the French CAC 40 index and is one of the world's leading hotel groups. The shares have been on a tear for most of the year but the recent correction caught my eye, and has presented clear buying signals.
My two main trading strategies are 1) to find a solid trend, wait for a decent correction, and then join the trend, and 2) use Elliott wave theory (EWT) to detect a major high or low and trade against the old trend. Both of these must be at low risk, meaning use of a close stop. This trade belongs to the first category.
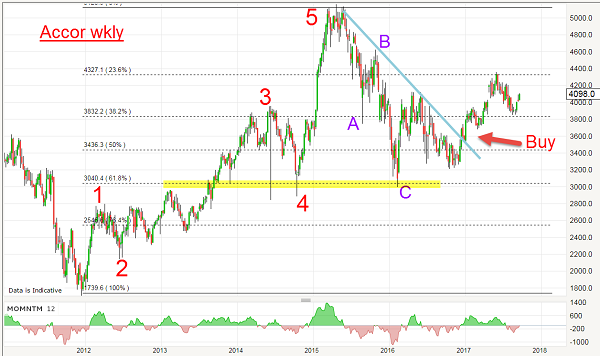
As ever, I will go to the longer-range chart for perspective. Here is the weekly going back to 2011.

The shares made a major low in 2012 and embarked on a very clear five-wave impulsive pattern. Of course, I was not to know that at the time, but when the market pushed up strongly in late 2013 away from the large congestion zone, that was a strong clue it was in a third wave (third waves are usually long and strong and are my favourite to trade).
That enabled a forecast for a wave 4 decline at some point and then a push to new highs in a fifth wave. In fact, that did materialise, and was a clear validation in the simple use of basic EWT. Note the very strong fifth wave to the April 2015 top at €51.60.
And note the five-wave internal pattern within the fifth wave with the requisite 'long and strong' third wave. All of this action is textbook ETW and, remember, is the only technical approach to the markets I know that can give highly reliable and accurate trend reversal forecasts.
From that June high, another forecast from EWT was that it could be a three-wave decline in true counter-trend fashion. That was duly accomplished with an A-B-C pattern with the C wave making its low at the textbook Fibonacci 62% retrace of the entire rally phase (yellow bar).
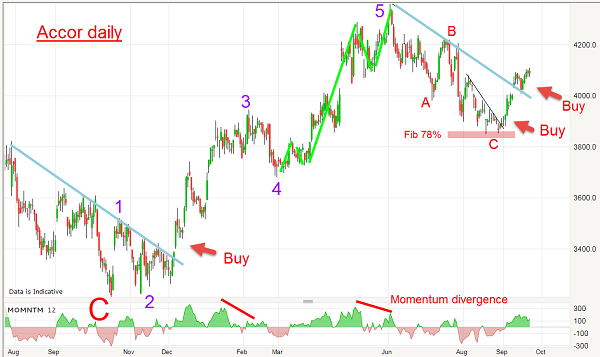
Here is a close-up of the wave C low and subsequent rally on the daily chart.

Suspecting a change in trend late last year, I drew a pretty blue downtrend line connecting the multiple highs, and when that was convincingly broken in December with a gap up, it presented a very strong buy signal.
And when the market just took off like a scalded cat, I know I was likely at the start of a five wave pattern up. At the wave 3 high, the momentum divergence hinted that wave 4 down was approaching and to prepare for the final wave 5 up, which culminated at the June high at €43.60.
After a five up comes a three down. That duly arrived, with the C wave terminating at the Fibonacci 78% retrace of the previous fifth wave. By then, I could draw in a minor trendline and, when the market broke above that, it gave me another buy signal with a protective stop placed just under my C wave low.
In recent days, the rally has continued and broken above the upper trendline, giving yet another buy signal. And that trade can be protected by a stop loss just under the recent low. My immediate target is the old high at €51.60.
Only a decline below the C wave low at around €38.50 would cause me to amend my outlook.
These articles are provided for information purposes only. Occasionally, an opinion about whether to buy or sell a specific investment may be provided by third parties. The content is not intended to be a personal recommendation to buy or sell any financial instrument or product, or to adopt any investment strategy as it is not provided based on an assessment of your investing knowledge and experience, your financial situation or your investment objectives. The value of your investments, and the income derived from them, may go down as well as up. You may not get back all the money that you invest. The investments referred to in this article may not be suitable for all investors, and if in doubt, an investor should seek advice from a qualified investment adviser.
Full performance can be found on the company or index summary page on the interactive investor website. Simply click on the company's or index name highlighted in the article.
Disclosure
We use a combination of fundamental and technical analysis in forming our view as to the valuation and prospects of an investment. Where relevant we have set out those particular matters we think are important in the above article, but further detail can be found here.
Please note that our article on this investment should not be considered to be a regular publication.
Details of all recommendations issued by ii during the previous 12-month period can be found here.
ii adheres to a strict code of conduct. Contributors may hold shares or have other interests in companies included in these portfolios, which could create a conflict of interests. Contributors intending to write about any financial instruments in which they have an interest are required to disclose such interest to ii and in the article itself. ii will at all times consider whether such interest impairs the objectivity of the recommendation.
In addition, individuals involved in the production of investment articles are subject to a personal account dealing restriction, which prevents them from placing a transaction in the specified instrument(s) for a period before and for five working days after such publication. This is to avoid personal interests conflicting with the interests of the recipients of those investment articles.