Chart of the week: A 34% profit in three months. What now?
Our chartist called the bottom of this blue-chip. Here’s his updated tip.
16th December 2019 10:39
by John Burford from interactive investor
In a terrific example of great timing, our chartist called the bottom of this blue-chip. Here’s his updated tip.

Is Barclays still a Boris Buy?
In my 9 September COTW: Is Barclays set up for a solid recovery now?, I asked if I should reverse my strongly bearish stance on the UK banks, particularly Barclays (LSE:BARC). I had been reaping big rewards on the short side as sentiment became progressively more bearish. But the charts were telling me perhaps the trend was reaching the end of the line and I had better start looking for a buy entry – and cover shorts.
Of course, the bearish story made a lot of sense with earnings from loans at tight margins as central banks were hell-bent on lowering short rates to ‘stimulate’ economies. In fact, I believed the central bank action was really another punishment for the ‘too big to fail’ banks that many said brought about the Credit Crunch of 2008. That, in addition to the PPI affair that drained banks’ capital- and restored some wealth back to the public. Not to mention the doom-and-gloom surrounding Brexit being a real negative. No wonder bank shares were shunned (but they still remained ‘too big to fail’!).
Just as it is usually darkest before the dawn, major lows are always and everywhere made when things look really bad. Of course, very few understand (or can guess) the detailed mechanisms that would improve sentiment after the lows – and hence raise the share price. But that is exactly what happens there as if by magic – and by reading the charts (more magic!), you can have a pretty good clue that a reversal is nigh.
And that is what I concluded on 9 September when I wrote: Finally, the ECB meets this week and most expect it to lower its policy rate below the minus 0.4% currently prevailing in order to juice the flagging EZ economy. But what if they make no changes, or just a small adjustment? EZ bonds should go nuts (to the upside) – and EU and UK banks rocket.
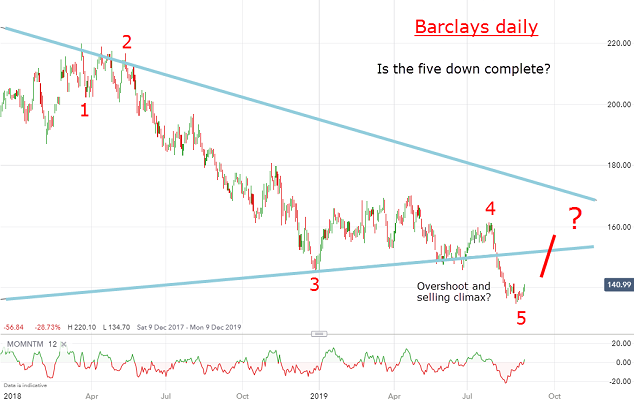
Here is the chart I showed to back up my case:

Source: interactive investor Past performance is not a guide to future performance
The blue lines delineate a large Wedge and in August, the shares plunged below it. I surmised then that this might turn out to be an ‘overshoot’ or selling climax, with short term rates plunging to new lows. The pundits were convinced they might even go negative.
In a terrific example of great timing, the actual low was at £1.35 on 28 August – a mere 12 days before my COTW. One factor that suggested the major low was in this area was the very large momentum divergence at the low on the short term charts. To me, the downside risk was low and yet the upside potential great as a bout of short covering would likely generate large gains very swiftly.
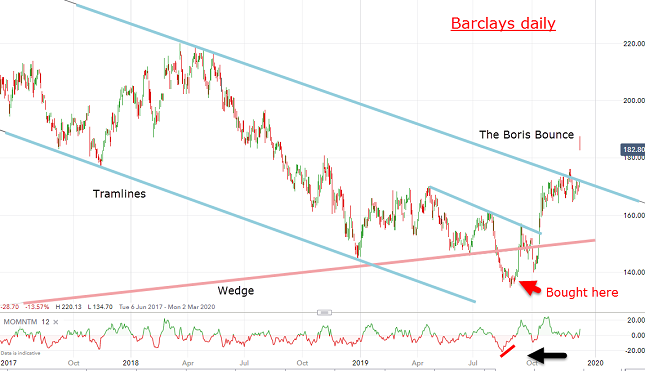
And this is the updated chart:

Source: interactive investor Past performance is not a guide to future performance
And with great timing I nailed the low, confirmed the ‘overshoot’ as the kick-off to a surge, and Friday’s Boris Bounce has broken above the upper wedge line on Friday. The shares are up 30% and have performed exactly as I forecast (as a rocket).
OK, is there any more upside? Good question! We could well see a pull-back (to perhaps the upper blue trendline), but the main trend now appears up. Of course, short term traders should be looking at locking in at least some great profits here.
For more information about Tramline Traders, or to take a three-week free trial, go to www.tramlinetraders.com.
John Burford is the author of the definitive text on his trading method, Tramline Trading. He is also a freelance contributor and not a direct employee of interactive investor.
These articles are provided for information purposes only. Occasionally, an opinion about whether to buy or sell a specific investment may be provided by third parties. The content is not intended to be a personal recommendation to buy or sell any financial instrument or product, or to adopt any investment strategy as it is not provided based on an assessment of your investing knowledge and experience, your financial situation or your investment objectives. The value of your investments, and the income derived from them, may go down as well as up. You may not get back all the money that you invest. The investments referred to in this article may not be suitable for all investors, and if in doubt, an investor should seek advice from a qualified investment adviser.
Full performance can be found on the company or index summary page on the interactive investor website. Simply click on the company's or index name highlighted in the article.
Disclosure
We use a combination of fundamental and technical analysis in forming our view as to the valuation and prospects of an investment. Where relevant we have set out those particular matters we think are important in the above article, but further detail can be found here.
Please note that our article on this investment should not be considered to be a regular publication.
Details of all recommendations issued by ii during the previous 12-month period can be found here.
ii adheres to a strict code of conduct. Contributors may hold shares or have other interests in companies included in these portfolios, which could create a conflict of interests. Contributors intending to write about any financial instruments in which they have an interest are required to disclose such interest to ii and in the article itself. ii will at all times consider whether such interest impairs the objectivity of the recommendation.
In addition, individuals involved in the production of investment articles are subject to a personal account dealing restriction, which prevents them from placing a transaction in the specified instrument(s) for a period before and for five working days after such publication. This is to avoid personal interests conflicting with the interests of the recipients of those investment articles.