Can European stocks outperform both the US and China?
Some analysts are tipping Europe to beat big rivals. We explain why and look at ETFs that could benefit.
3rd August 2020 15:04
by Tom Bailey from interactive investor
Some analysts are tipping Europe to beat big rivals. We explain why and look at ETFs that could benefit.

One of the most notable trends in financial markets in recent years has been the persistent outperformance of US equities over European. Over the past 10 years, the MSCI Europe index has provided investors with a total return of 94.5%. In contrast, the MSCI USA index has returned roughly 311%.
On several occasions, market commentators and analysts predicted a reversal of this trend, arguing that Europe was on the cusp of a bounceback. However, each time, forecasts mostly fell flat.
The divergence is partly explained by the sector and factor exposure of the two indices. The US market is filled with tech and growth stocks compared to Europe.
However, another drag on European equity performance was the Continent’s poor economic performance. The Continent spent the first half of the decade trying to contain the crisis in Greece. In the second half, growth remained fragile, weakening further as the global economy started to slow. In contrast, the US economy saw steady, albeit historically sluggish, growth.
- Invest with ii: Most-traded US Stocks | Buy International Shares | Top UK Shares
However, given the global outbreak of coronavirus the European economy might now start to outperform, according to a recent Goldman Sachs Economics Research note.
“Europe remains on track to outperform other regions - especially the US - during the recovery from the corona crisis,” Goldman Sachs argues.
- Why the government pursuing inflation is not something investors should worry about
- How investors can still profit from emerging markets in a deglobalising world
- Ian Cowie: buying gold and high yield on the cheap
Goldman Sachs points out that while Europe has started to see some local outbreaks in recent weeks, overall infection rates have remained low as economies have re-opened. The note says: “A second virus wave clearly remains a risk, but our analysis suggests that Europe is well placed to continue its steady reopening process while keeping infection rates low.”
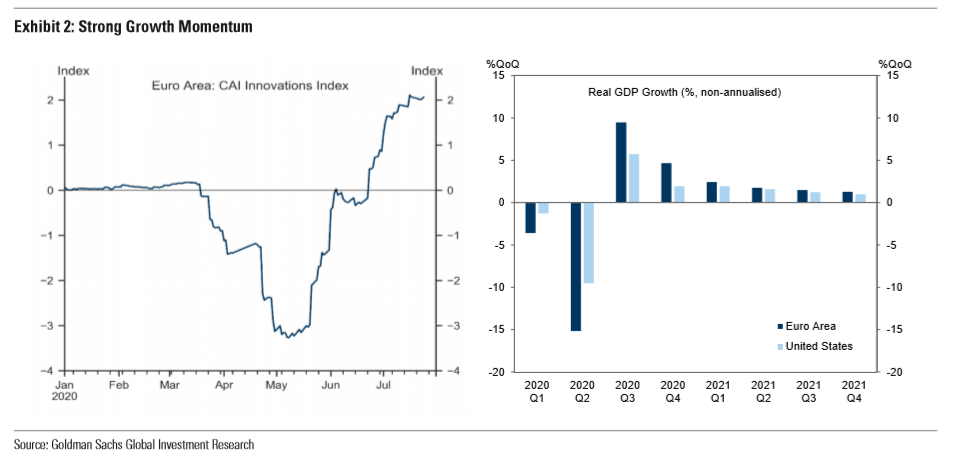
Goldman Sachs notes that while they expect a record GDP contraction in the eurozone in the second quarter, the economy is now gaining momentum. The eurozone’s composite PMI came in at 54.8 points, the highest level since 2018. Goldman Sachs says it expects a strong rebound in the third quarter, with GDP growth coming in at 9.5%. They continue: “The Euro area thus looks set to outgrow the US quite notably in the second half of 2020, with renewed containment measures in the US likely to put consumer spending on pause in July and August.”
In particular, the recent agreement between EU leaders on the Recovery Plan bodes well for growth, adding much needed fiscal stimulus for Europe’s worst affected economies. The agreed deal of €390 billion (£350.8 billion) was smaller than the sum originally proposed, but still significant. Goldman Sachs notes: “We estimate that Italy and Spain will receive grants of 5% and 6% of GDP, respectively, during 2021-23, plus cheap loans of up to 7% of GDP.”
On top of this union-wide agreement, Goldman Sachs expects further fiscal stimulus at a national level. They note that further stimulus has already been announced in Germany, worth 3.5% of GDP over 2020-21, and in France, worth 4% of GDP over the same time period.
- GRANOLAS: The new acronym for Europe’s superstar stocks
- ii view: Amazon sales rocket
- 10 sector-beating stocks in an uncertain market
As Richard Koo, chief economist at the Nomura Research Institute, explains in his book The Other Half of Macroeconomics, Europe’s slow recovery following the financial crisis can partly be explained by its reluctance to engage in much-needed fiscal stimulus. This was both the result of an adherence to strict budget deficit rules by some countries, as well as the reluctance of many European leaders to take the route of shared fiscal responsibility. European leaders agreeing to the Recovery Plan suggests a shift a sentiment this time around.


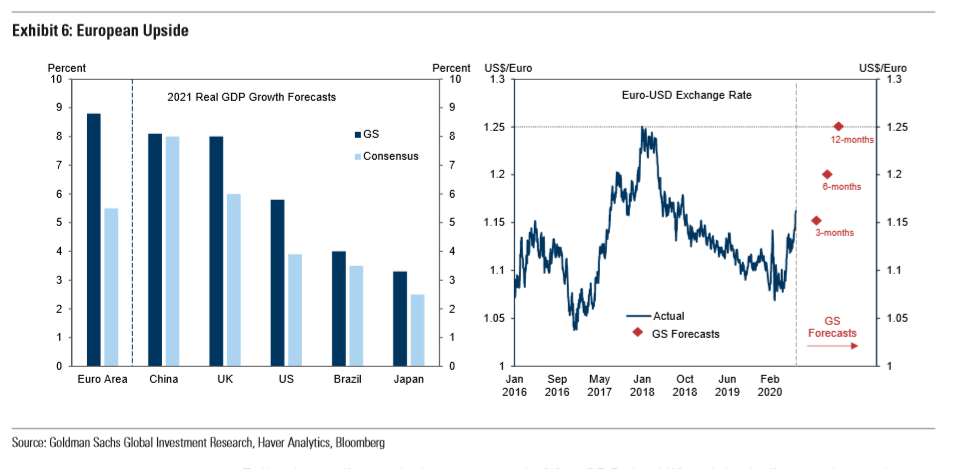
Against the backdrop of the virus under control and continued monetary support from the European Central Bank, these generous fiscal measures should result in strong performance from the eurozone’s economy. Indeed, Goldman Sachs says they are forecasting the eurozone having the fastest GDP growth rate of any major country around the world in 2021, including that of China.
Other commentators are also now looking on Europe more favourably than the US. Seema Shah, chief strategist at Principal Global Investors, notes: “The EU now suddenly looks more credible, cohesive and proactive and has demonstrated that it has more than simply ailing monetary policy in its arsenal – all of which is continuing to create tailwinds for the single currency.”
As a result, Goldman Sachs expects strong performance from European assets. They note: “Our markets team has turned significantly more positive on European assets, expecting the euro to reach 1.25 against the dollar in 12 months and looking for European equity outperformance against the US in the near term.”
How to gain exposure to Europe via ETFs
In terms of exposure to European equities, ETF and index fund investors have several indices to chose from.
One of the most popular is the EURO STOXX 50 index, featuring 50 stocks from 11 eurozone countries. This tracks the biggest European listed firms and is often seen as the bellwether for European equites.
There are several ETFs that track this index, with very low charges. The iShares EURO STOXX 50 UCITS ETF (LSE:EUE) is one of the most popular and has an ongoing charge of just 0.10%. However, even cheaper is the Xtrackers EURO STOXX 50 UCITS ETF (LSE:XESC), charging 0.09%, and the HSBC EURO STOXX 50 ETF (LSE:H50E), which charges just 0.05%.
However, as noted, this tracks 50 of Europe’s largest companies. For those wishing for broader and more diversified exposure to European equities, other options exist.
One potential option is the MSCI Europe index. This index is much larger, including around 450 equities, both large- and mid-cap. However, it also includes non-eurozone countries, with its biggest weighting being towards UK equities, accounting for over 20%. As a result, this index may not be appropriate for specifically looking for continental exposure.
A solution would be the MSCI Europe ex-UK index, which holds roughly 350 stocks. This can be tracked via the iShares MSCI Europe ex-UK ETF (LSE:IEUX). The biggest downside, however, is that it has a relatively pricey ongoing charge of 0.4%
Another option is the FTSE Developed Europe ex UK Index. This also includes large- and mid-cap exposure, with around 450 holdings. This can be tracked using the Vanguard FTSE Developed Europe ex UK UCITS ETF (LSE:VERX), which has an ongoing charge of 0.10%.
It should be kept in mind, however, that both the MSCI and FTSE indices have significant exposure to non-eurozone countries even when the UK is excluded. Both have around 20% exposure to Switzerland, for example. This means that ETFs tracking these indices will see less lift from a strengthening euro than an ETF tracking the eurozone-only EURO STOXX 50 index.
These articles are provided for information purposes only. Occasionally, an opinion about whether to buy or sell a specific investment may be provided by third parties. The content is not intended to be a personal recommendation to buy or sell any financial instrument or product, or to adopt any investment strategy as it is not provided based on an assessment of your investing knowledge and experience, your financial situation or your investment objectives. The value of your investments, and the income derived from them, may go down as well as up. You may not get back all the money that you invest. The investments referred to in this article may not be suitable for all investors, and if in doubt, an investor should seek advice from a qualified investment adviser.
Full performance can be found on the company or index summary page on the interactive investor website. Simply click on the company's or index name highlighted in the article.