Britain's Warren Buffett: The two trusts that could repeat his success
9th November 2018 16:27
This content is provided by Kepler Trust Intelligence, an investment trust focused website for private and professional investors. Kepler Trust Intelligence is a third-party supplier and not part of interactive investor. It is provided for information only and does not constitute a personal recommendation.
Material produced by Kepler Trust Intelligence should be considered a marketing communication, and is not independent research.
New research claims to have identified the secret of Warren Buffett's success; we apply similar principles to find the UK's answer to The Sage of Omaha.
The Great British Buffett
Thomas McMahon, senior analyst at Kepler Trust Intelligence.
Research due to be published in the CFA's Financial Analysts Journal claims to demystify Warren Buffett’s astonishing long-term success, and shows how he has achieved his incredible run of returns. In a nutshell, the Buffett “secret sauce” is leveraging up low beta, cheap, high quality stocks. This approach has allowed Buffett to generate a high information ratio over a multi-decade career, showing that his active bets have generated significant value over a passive investment strategy.
We identify the UK's closed-ended fund managers who have had comparable success to Buffett measured by their information ratio (albeit over a shorter time frame) and then identify whose approaches are most similar to Buffett's. We then consider whether Buffett's secret sauce is past its sell by date – could it be that the approach which worked so well for him is dated in a world where innovative disruption is occurring at an ever-faster pace and, if so, who will take his place?
Buffett's secret sauce
Buffett's Berkshire Hathaway (Berkshire) investment company has generated an information ratio of 0.64 versus the S&P 500 over the manager's 40-year career, according to a recent paper by Frazzini, Kabiller and Pedersen. The information ratio looks at the alpha added relative to the risk of an investment. The superiority over the Sharpe ratio comes from the fact that the risk looked at is the risk relative to the benchmark (the tracking error). In our view it is the best statistic for judging the performance of an active manager - but only when an appropriate benchmark is chosen.
Frazzini, Kabiller and Pedersen used factor analysis to understand how Buffett has generated his impressive information ratio. They examined Berkshire stock from October 1976, when their data began, to March 2017, and conducted a series of regressions to understand which factors best explained Berkshire's returns. When controlling only for exposure to the market, or beta, Berkshire Hathaway generated alpha of 13.4% per annum. However, when certain key factors were introduced to the model, it became clear that certain stylistic exposures were responsible for the bulk of these excess returns.
The crucial contributory factors to his performance were exposure to quality characteristics, exposure to value characteristics and selecting low beta stocks, in descending order. Once these biases were taken into consideration, the alpha dropped to 5.4% per annum.
Buffett's returns explained (significant factors in bold)
| Factor | Coefficient |
|---|---|
| Beta | 0.95 |
| Size | -0.13 |
| Value | 0.4 |
| Momentum | -0.05 |
| Low beta | 0.27 |
| Quality | 0.47 |
Source: Frazzini, Kabiller and Pedersen (2018)
Buffett is well-known as a proponent of value investing, and so it is not surprising that this was a significant factor in his returns.
Interestingly however, value has proved to be less significant a driver of returns than quality. The addition of the quality factor and the low beta factor in the analysis were the key innovations of this paper, reducing the weight given to the value factor in the regression and the alpha calculated.
In our view, there is an iconoclastic nature to these results in that they suggest Buffett's alpha-generation has been lower than is often claimed. However, there is no question that even if most of the excess returns over the market have come only from "factor tilts", a manager still has to select the right tilts, so it is only the "stockpicking" skill of Buffett which is diminished in this analysis, not his overall money management skills.
The second key reason for Buffett's outperformance identified by the authors was his use of leverage. By their calculations Buffett averaged a leverage factor of between 1.4 to 1 and 1.7 to 1, or in other words was 40% to 70% geared over the course of his career (the range reflects there is difficulty calculating the exact figure). Such high levels of gearing are rarely found in the investment company universe, and partly reflect Berkshire's presence in the insurance market which gives the company access to cheap funding. Buffett also benefits from being able to raise investment grade debt and use derivatives to increase gearing.
The authors conclude that gearing up an effective strategy of buying high quality, low beta and cheap stocks explains Buffett's excess returns over the market and a passive investment strategy and his exceptional information ratio of 0.64. This figure would put it in the 97th percentile of US equity funds in the authors’ database and is the best figure for those funds with at least 10 years' history.
The candidates
In order to identify UK investment trust managers who have delivered returns resembling those of the great man, we began by considering those with the most impressive information ratios of all investment trusts investing in public equities, with a track record of over 10 years.
It's worth noting that 10 years is less than a quarter of Buffett's investment career, but so few managers have a track record over a longer period that the number of trusts quickly becomes too small to be interesting. We used regression analysis to select the most appropriate benchmark for each trust. Only 10 trusts generated an information ratio equal to or higher than 0.64 over this time period.
Highest Information Ratios
| Manager | Manager Tenure (Longest) | Return (Annualized) | Information Ratio (GEO) | |
|---|---|---|---|---|
| Baillie Gifford Japan | Matthew Brett | 0.5 | 18.37 | 1.11 |
| Jupiter European Opportunities | Alexander Darwall | 17.92 | 18.36 | 1.09 |
| Baillie Gifford Shin Nippon | Praveen Kumar | 2.92 | 24.36 | 1.06 |
| Finsbury Growth & Income | Nick Train | 17.83 | 17.5 | 0.97 |
| BlackRock Throgmorton Trust | Dan Whitestone | 3.58 | 19.61 | 0.87 |
| Henderson European Focus Trust | John Bennett | 7.83 | 12.41 | 0.83 |
| Schroder Japan Growth | Andrew Rose | 10.92 | 12.07 | 0.82 |
| Henderson EuroTrust | Tim Stevenson | 24.75 | 12.37 | 0.8 |
| BlackRock Smaller Companies | Mike Prentis | 16.17 | 18.96 | 0.69 |
| Henderson Smaller Companies | Neil Hermon | 15.92 | 18.15 | 0.64 |
Source: Morningstar
Of that number, only six had a manager who had been in charge for longer than 10 years. However, in the case of two other funds, there has been a recent replacement of a manager who had previously run it for over 10 years, so we can consider those track records as being of the previous manager and/or that the product of a team approach. For example, Sarah Whitley managed the Baillie Gifford Japan trust from 1991 to April of this year, making her a prime candidate for being Britain’s Buffett. Sarah retired and handed over to Matthew Brett in April 2018.
However, the collegiate nature of Ballie Gifford's strategy and the strong house view means that we would argue the change of manager is less important than it would be on most other trusts. Mike Prentis ran BlackRock Throgmorton from July 2008 until December 2017. He remains manager of BlackRock Smaller Companies, which he joined as manager in 2002.
Three trusts have had the same manager for longer than 15 years. The longest-serving manager in the trusts above is about to retire – Janus Henderson's Tim Stevenson, who has run Henderson EuroTrust for almost 25 years. Other managers on the list who stand out from a longevity point of view are Alexander Darwall and Nick Train, who have each served for almost 18 years on their trusts.
Only the managers of Henderson European Focus and Baillie Gifford Shin Nippon have not been in place long enough to be considered candidates for the title of "The British Buffett", although in the former case John Bennett has been running the trust for “only” eight years.
Low beta
Buffett's preference for low beta stocks means that on a simple capital asset pricing model his beta was just 0.69 over the period of review. None of our candidates came close to that, with Finsbury Growth and Income and Henderson EuroTrust the closest at 0.85 and 0.87 respectively.
Interestingly, seven of the 10 trusts in our shortlist have a beta over one. These are all high growth strategies, while four of them are smaller companies funds. It is possible that this reflects a bias in our restricted 10-year sample.
As we discussed in a recent strategy piece, value strategies did well in generating alpha until the turn of the millennium, but since then have failed to do so. It stands to reason that the best results (in terms of information ratio) since then have been seen in higher growth approaches.
Beta of trusts
| Beta to best fit index | |
|---|---|
| Finsbury Growth & Income | 0.84 |
| Henderson EuroTrust | 0.87 |
| Henderson European Focus Trust | 0.95 |
| BlackRock Throgmorton Trust | 1.03 |
| BlackRock Smaller Companies | 1.05 |
| Henderson Smaller Companies | 1.09 |
| Jupiter European Opportunities | 1.11 |
| Schroder Japan Growth | 1.15 |
| Baillie Gifford Japan | 1.2 |
| Baillie Gifford Shin Nippon | 1.27 |
Source: Morningstar
FGT has been managed by Nick Train since 2001. Nick runs a concentrated portfolio with a long-term, low turnover style – an approach which he shares with Warren Buffett. Nick aims to buy companies with brands or intellectual property which would be hard or impossible to replicate, which often leads him towards steady growth companies such as Unilever, Diageo, The Kraft Heinz and Dr Pepper Snapple. The focus is on long-term sustainable growth, and the result is a low beta portfolio.
Henderson EuroTrust also takes a long-term approach to stock-picking. In fact, it is notable that many of the trusts with the best information ratios have this in common with each other and with Buffett.
Since 1995, Tim has run this portfolio with a growth bias, and the trust is tilted to companies with steady international growth that are headquartered in Europe. Although it does not aim for a yield per se, the board does value dividend growth, and the trust has seen its dividend grow at over 15% over the past 15 years.
Quality
Looking at quality as a factor is a relatively new practice, and applying quality in the regression analysis is one of the innovations of the Frazzini, Kabiller and Pedersen paper. Unfortunately, we do not have indices with enough of a track record to do a quantitative screen for this factor on our shortlist.
However, from our meetings with the managers, we know there is a strong quality tilt to a number of the trusts with elite information ratios. The Baillie Gifford Japan and Baillie Gifford Shin Nippon trusts have a quality bias, looking for companies with strong ROE and low levels of debt. Baillie Gifford Japan has the highest information ratio of any trust over 10 years, 1.11.
As we note above, Henderson EuroTrust has a strong quality tilt to the growth companies it looks for, as does Jupiter European Opportunities. Alexander Darwall has run this trust since 2000 with a resolutely bottom-up approach. He runs a highly concentrated portfolio and looks for companies which should prosper through different market environments and changes of the cycle.
Alexander places great importance in meeting and understanding management teams. His success is attested to by the information ratio of 1.09 over 10 years, which is the second-highest in the closed-ended trust sphere. We have recently updated our note on the trust. Finsbury Growth and Income also qualifies on this metric due to the manager's focus on companies with defendable brands and niches which should allow them to grow faster than the market consistently.
Value
There is only one growth trust with a value tilt in our shortlist: ironically named Schroder Japan Growth. Andrew Rose balances this value approach with a significant tilt towards small caps and a tendency towards high gearing (see section below). While many of the other managers cite valuation as important in their stock selection, in our view it is in each case at best a secondary consideration when compared to Andrew Rose's approach.
Value Exposure
| Equity Style Growth % (NET) | Equity Style Value % (NET) | |
|---|---|---|
| Schroder Japan Growth | 18 | 56 |
| Henderson European Focus Trust | 42 | 25 |
| Henderson Smaller Companies | 47 | 18 |
| Henderson EuroTrust | 45 | 16 |
| BlackRock Smaller Companies | 61 | 12 |
| Baillie Gifford Japan | 59 | 12 |
| BlackRock Throgmorton Trust | 63 | 7 |
| Jupiter European Opportunities | 73 | 1 |
| Finsbury Growth & Income | 65 | 1 |
| Baillie Gifford Shin Nippon | 75 | 1 |
Source: Morningstar
Leverage
Berkshire's net gearing is undoubtedly higher over the cycle than most investment trusts, at 140% to 170% depending on how it is calculated. Over the past 10 years the highest average net gearing on our shortlist, according to Morningstar data, was the 22.5% of BlackRock Throgmorton. This trust uses CFDs to gear up and runs a short book as well as a book of long CFD exposure and cash equities.
Baillie Gifford Japan and Jupiter European Opportunities have also been run with high average levels of gearing. In both cases this caused severe share price falls during the 2008 crisis, when investors worried that a falling NAV and a relatively fixed level of gearing would leave trusts over levered. However, both trusts came through the 2008/2009 period without permanently impairing capital by deleveraging at the trough.
As such, if we extend our analysis back 15 years to a period which includes the crisis, both remain top of the return tables and with information ratios that beat our screens. This is testament to the value gearing can add over the long run if managers are able to maintain it through each cycle.
10 year average net gearing
| 10-year average net gearing | |
|---|---|
| BlackRock Throgmorton Trust plc | 22.5 |
| BG Japan | 16 |
| Jupiter European Opportunities | 15.7 |
| BG Shin Nippon | 12.5 |
| Schroder Japan Growth Ord | 12 |
| Henderson Smaller Companies Ord | 10 |
| BlackRock Smaller Companies Ord | 9.7 |
| Henderson European Focus Trust Ord | 5 |
| Finsbury Growth Income | 4.6 |
| Henderson EuroTrust Ord | 2 |
Source: Morningstar
Britain's Buffett
We ranked all 10 trusts for beta, quality, value and leverage, a score of one being the highest, and 10 the lowest. As we don’t have enough data to rank trusts on "quality" we gave a two to the trusts we regard as having a quality tilt and an eight to those we do not, trying to get close to the 25th and 75th percentiles of the range.
The value factor we have looked at is the shakiest of the quant metrics due to the fact that we are only looking at a snapshot of the current portfolio, historic data on the portfolio's exposure to value / growth over time not being available. We believe that the two trusts currently with the highest value exposure, have almost certainly had the highest value exposure over the long run. As such, we have scored all the other trusts equally on this metric. The lowest 'Buffett Score' is the winner.
The results of our ranking are reproduced in the table below - with the information ratio rank included for comparison but not featuring in the analysis. Those most deserving of the Britain's Buffett epithet are Nick Train (with Finsbury Growth and Income) and Alexander Darwall (Jupiter European Opportunties) each scoring 18.
Final Results
| Information Ratio | Beta | Quality | Leverage | Value | Buffett Score | |
|---|---|---|---|---|---|---|
| Jupiter European Opportunities | 2 | 7 | 2 | 3 | 6 | 18 |
| Finsbury Growth & Income | 4 | 1 | 2 | 9 | 6 | 18 |
| BlackRock Throgmorton Trust | 5 | 4 | 8 | 1 | 6 | 19 |
| Baillie Gifford Japan | 1 | 9 | 2 | 2 | 6 | 19 |
| Henderson EuroTrust | 8 | 2 | 2 | 10 | 6 | 20 |
| Schroder Japan Growth | 7 | 8 | 8 | 5 | 1 | 22 |
| Baillie Gifford Shin Nippon | 3 | 10 | 2 | 4 | 6 | 22 |
| Henderson European Focus Trust | 6 | 3 | 8 | 8 | 6 | 25 |
| Henderson Smaller Companies | 10 | 6 | 8 | 6 | 6 | 26 |
| BlackRock Smaller Companies | 9 | 5 | 8 | 7 | 6 | 26 |
Source: Kepler calculations
It should be emphasised, this is not our opinion on who is the best manager. Our analysis simply tries to identify which manager follows an investment approach closest to that of Warren Buffett out of all those with a comparable performance record (albeit over a shorter time frame than the 88-year-old Buffett's incredible 52 years at Berkshire Hathaway).
Jam tomorrow
Past performance is not necessarily a good guide to the future. Markets evolve and it is possible that what worked for Buffett in the past forty years will be less effective in the future. We have already seen that there is a growth bias to the trusts which have done the best over the past 10 years. This may be one reason why Buffett has actually underperformed the S&P 500 by 0.71% a year on average over the past decade.
In particular, we worry that the "low beta anomaly" which Buffett has exploited will not work so well in future now it has been so thoroughly mined and exploited. This "low beta anomaly" is the curious fact that low beta stocks have outperformed high beta stocks over multiple time periods and multiple geographies.
Academic research on this phenomenon is now widely disseminated, and there are multiple ETFs designed to exploit it or play the same trend. Anomalies cannot logically persist if they are widely known about, and over time become harder to exploit as returns get arbitraged away.
In that light, the high beta shown by a number of the trusts in our shortlist is interesting. Could this show that Buffett’s approach that worked well for so many decades, has been superseded in a world where innovative disruption is occurring at an ever-faster pace? Or could it just be a reflection of the latter stages in a growth bubble fed by QE and low interest rates?
In the graph below, we believe it is interesting that the iShares MSCI World Minimum Volatility ETF (a proxy for low beta stocks; its beta to the main index is 0.77) has underperformed the iShares Core MSCI World ETF since mid-2016, shortly after the rate hiking cycle became accepted by markets as being properly underway, and not just a false start by an over-hasty FED. The below graph shows the returns of the MSCI World Minimum Volatility ETF minus the MSCI World ETF; an upward sloping line means lower volatility stocks are outperforming and a downward sloping line underperforming.
Relative performance of indices
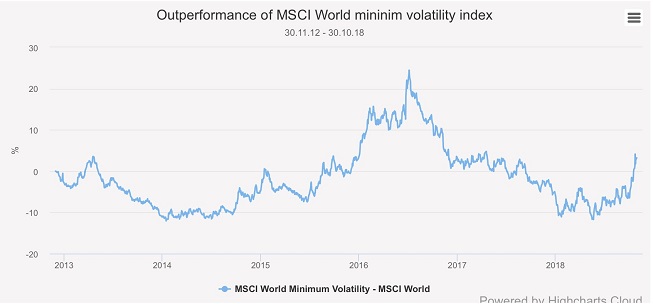
Source: FE Analytics
One reason why low vol. stocks might continue to underperform, aside from it being a factor that is arbitraged away, is the structure of the market and society. In a world in which technology companies are transforming so many areas of life with secular trends, maybe the higher growth, higher beta stocks will dominate returns? In that case, it may be the growthier, higher beta approaches which dominate in the coming decades, and the Buffett's of the future may not share his historic low beta characteristics.
In that light, the much higher beta approach of Scottish Mortgage may produce greater excess returns over the next 40 years than a lower beta approach more similar to Warren Buffett's. Scottish Mortgage didn't quite make the cut on information ratio, although its 0.45 put it in the top decile of trusts over our time horizon. The beta is a strikingly high 1.45, considerably higher than any trusts on our shortlist and higher than any trust with a 10-year history except the same manager's small-cap focused Edinburgh Worldwide.
Kepler Partners is a third-party supplier and not part of interactive investor. Neither Kepler Partners or interactive investor will be responsible for any losses that may be incurred as a result of a trading idea.
Important Information
Kepler Partners is not authorised to make recommendations to Retail Clients. This report is based on factual information only, and is solely for information purposes only and any views contained in it must not be construed as investment or tax advice or a recommendation to buy, sell or take any action in relation to any investment.
This report has been issued by Kepler Partners LLP solely for information purposes only and the views contained in it must not be construed as investment or tax advice or a recommendation to buy, sell or take any action in relation to any investment. If you are unclear about any of the information on this website or its suitability for you, please contact your financial or tax adviser, or an independent financial or tax adviser before making any investment or financial decisions.
The information provided on this website is not intended for distribution to, or use by, any person or entity in any jurisdiction or country where such distribution or use would be contrary to law or regulation or which would subject Kepler Partners LLP to any registration requirement within such jurisdiction or country. Persons who access this information are required to inform themselves and to comply with any such restrictions. In particular, this website is exclusively for non-US Persons. The information in this website is not for distribution to and does not constitute an offer to sell or the solicitation of any offer to buy any securities in the United States of America to or for the benefit of US Persons.
This is a marketing document, should be considered non-independent research and is subject to the rules in COBS 12.3 relating to such research. It has not been prepared in accordance with legal requirements designed to promote the independence of investment research.
No representation or warranty, express or implied, is given by any person as to the accuracy or completeness of the information and no responsibility or liability is accepted for the accuracy or sufficiency of any of the information, for any errors, omissions or misstatements, negligent or otherwise. Any views and opinions, whilst given in good faith, are subject to change without notice.
This is not an official confirmation of terms and is not to be taken as advice to take any action in relation to any investment mentioned herein. Any prices or quotations contained herein are indicative only.
Kepler Partners LLP (including its partners, employees and representatives) or a connected person may have positions in or options on the securities detailed in this report, and may buy, sell or offer to purchase or sell such securities from time to time, but will at all times be subject to restrictions imposed by the firm’s internal rules. A copy of the firm’s conflict of interest policy is available on request.
Past performance is not necessarily a guide to the future. The value of investments can fall as well as rise and you may get back less than you invested when you decide to sell your investments. It is strongly recommended that Independent financial advice should be taken before entering into any financial transaction.
PLEASE SEE ALSO OUR TERMS AND CONDITIONS
Kepler Partners LLP is a limited liability partnership registered in England and Wales at 9/10 Savile Row, London W1S 3PF with registered number OC334771.
Kepler Partners LLP is authorised and regulated by the Financial Conduct Authority.
Kepler Partners is a third-party supplier and not part of interactive investor. Neither Kepler Partners or interactive investor will be responsible for any losses that may be incurred as a result of a trading idea.
These articles are provided for information purposes only. Occasionally, an opinion about whether to buy or sell a specific investment may be provided by third parties. The content is not intended to be a personal recommendation to buy or sell any financial instrument or product, or to adopt any investment strategy as it is not provided based on an assessment of your investing knowledge and experience, your financial situation or your investment objectives. The value of your investments, and the income derived from them, may go down as well as up. You may not get back all the money that you invest. The investments referred to in this article may not be suitable for all investors, and if in doubt, an investor should seek advice from a qualified investment adviser.
Full performance can be found on the company or index summary page on the interactive investor website. Simply click on the company's or index name highlighted in the article.
Important Information
Kepler Partners is not authorised to make recommendations to Retail Clients. This report is based on factual information only, and is solely for information purposes only and any views contained in it must not be construed as investment or tax advice or a recommendation to buy, sell or take any action in relation to any investment.
This report has been issued by Kepler Partners LLP solely for information purposes only and the views contained in it must not be construed as investment or tax advice or a recommendation to buy, sell or take any action in relation to any investment. If you are unclear about any of the information on this website or its suitability for you, please contact your financial or tax adviser, or an independent financial or tax adviser before making any investment or financial decisions.
The information provided on this website is not intended for distribution to, or use by, any person or entity in any jurisdiction or country where such distribution or use would be contrary to law or regulation or which would subject Kepler Partners LLP to any registration requirement within such jurisdiction or country. Persons who access this information are required to inform themselves and to comply with any such restrictions. In particular, this website is exclusively for non-US Persons. The information in this website is not for distribution to and does not constitute an offer to sell or the solicitation of any offer to buy any securities in the United States of America to or for the benefit of US Persons.
This is a marketing document, should be considered non-independent research and is subject to the rules in COBS 12.3 relating to such research. It has not been prepared in accordance with legal requirements designed to promote the independence of investment research.
No representation or warranty, express or implied, is given by any person as to the accuracy or completeness of the information and no responsibility or liability is accepted for the accuracy or sufficiency of any of the information, for any errors, omissions or misstatements, negligent or otherwise. Any views and opinions, whilst given in good faith, are subject to change without notice.
This is not an official confirmation of terms and is not to be taken as advice to take any action in relation to any investment mentioned herein. Any prices or quotations contained herein are indicative only.
Kepler Partners LLP (including its partners, employees and representatives) or a connected person may have positions in or options on the securities detailed in this report, and may buy, sell or offer to purchase or sell such securities from time to time, but will at all times be subject to restrictions imposed by the firm's internal rules. A copy of the firm's conflict of interest policy is available on request.
Past performance is not necessarily a guide to the future. The value of investments can fall as well as rise and you may get back less than you invested when you decide to sell your investments. It is strongly recommended that Independent financial advice should be taken before entering into any financial transaction.
PLEASE SEE ALSO OUR TERMS AND CONDITIONS
Kepler Partners LLP is a limited liability partnership registered in England and Wales at 9/10 Savile Row, London W1S 3PF with registered number OC334771.
Kepler Partners LLP is authorised and regulated by the Financial Conduct Authority.
These articles are provided for information purposes only. Occasionally, an opinion about whether to buy or sell a specific investment may be provided by third parties. The content is not intended to be a personal recommendation to buy or sell any financial instrument or product, or to adopt any investment strategy as it is not provided based on an assessment of your investing knowledge and experience, your financial situation or your investment objectives. The value of your investments, and the income derived from them, may go down as well as up. You may not get back all the money that you invest. The investments referred to in this article may not be suitable for all investors, and if in doubt, an investor should seek advice from a qualified investment adviser.
Full performance can be found on the company or index summary page on the interactive investor website. Simply click on the company's or index name highlighted in the article.