Are Lloyds Bank shares heading up to pre-pandemic prices?
25th July 2022 07:46
by Alistair Strang from Trends and Targets
Britain's most popular share is a constant frustration for independent analyst Alistair Strang, but the odds of a rally are beginning to improve.

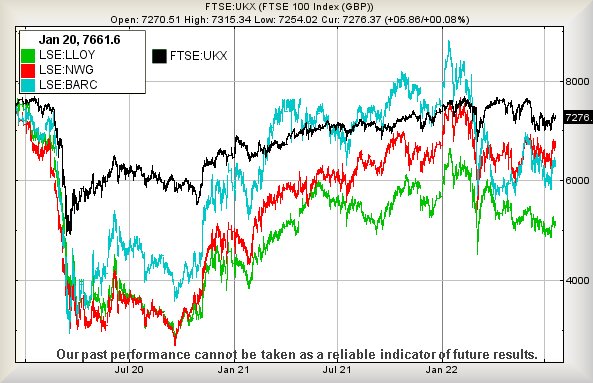
As always, we’re frustrated with Lloyds Banking Group (LSE:LLOY). When we glance at the FTSE 100 since the start of 2020 before the pandemic, the index is down 4.3%. In the same period, Lloyds Bank's share price is down 31.7%!
Surely the retail banks must discover an excuse to exhibit some recovery, if only to mirror FTSE movements. Even the Barclays (LSE:BARC) share price is down by 15% compared with the start of 2020 whereas NatWest Group (LSE:NWG) has only suffered a 5.4% price discount.
Technically speaking, it’s all just not fair. In fairness to NatWest, there’s a constant feeling the market simply cannot be bothered with NatWest dramatics and this, unfortunately, tends to suggest that, should any recovery occur, we will find NatWest sneaking behind the bicycle shed for a smoke, while the rest of the retail banks pedal off into the distance.
Traditionally, we do tend to be quite sceptical about NatWest. But in the case of Lloyds, if there’s any truth in an argument a price needs to go down before it can go up, with a 31.7% reduction, maybe it’s poised to display some surprise behaviour at some point in the future. We shall continue to hope.
The pretty chart below illustrates quite painfully the lack of excitement with Lloyds Bank. Maybe the recent order from the banking authority demanding they display customer satisfaction statistics in branches will make all the difference to the company shares.

Past performance is not a guide to future performance.
Currently, we notice a few commentators refer to Lloyds shares as “cheap”, something which makes us cringe, often the kiss of death to a share price. Remember, the #1 Rule in the marketplace is a lack of any guarantee.
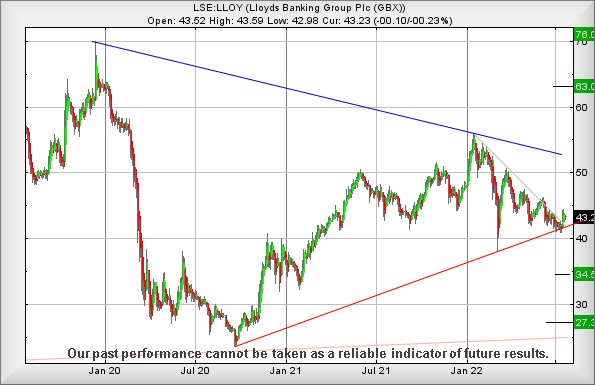
But in our hunt for sanity with Lloyds, we’re now inclined to allocate 47.3p as a potential trigger level, one which should finally give early warning the price is coming out of the gutter and making an attempt to head upward.
Should the market deign to sprinkle some pixy dust on such a trigger, the Big Picture now suggests the potential for strong movement as the longer term view currently calculates movement above 47.3p as capable of reaching for an initial 63p, essentially a return to the pre-Pandemic price level.
Our secondary, should the initial be exceeded, works out at 76p and a visit to price levels not witnessed since 2014. Visually, our 63p ambition is believable but the jury is firmly “out” on the secondary.
Unfortunately, there’s always an alternate scenario. In the event Lloyds share price opts to wear big clown shoes and a red nose, below 41p looks especially dangerous as there’s a real risk such a trigger shall provoke reversal to 34p next with secondary, if broken, at 27p and hopefully a bounce from the clown trampoline.

Past performance is not a guide to future performance.
Alistair Strang has led high-profile and "top secret" software projects since the late 1970s and won the original John Logie Baird Award for inventors and innovators. After the financial crash, he wanted to know "how it worked" with a view to mimicking existing trading formulas and predicting what was coming next. His results speak for themselves as he continually refines the methodology.
Alistair Strang is a freelance contributor and not a direct employee of Interactive Investor. All correspondence is with Alistair Strang, who for these purposes is deemed a third-party supplier. Buying, selling and investing in shares is not without risk. Market and company movement will affect your performance and you may get back less than you invest. Neither Alistair Strang or Interactive Investor will be responsible for any losses that may be incurred as a result of following a trading idea.
These articles are provided for information purposes only. Occasionally, an opinion about whether to buy or sell a specific investment may be provided by third parties. The content is not intended to be a personal recommendation to buy or sell any financial instrument or product, or to adopt any investment strategy as it is not provided based on an assessment of your investing knowledge and experience, your financial situation or your investment objectives. The value of your investments, and the income derived from them, may go down as well as up. You may not get back all the money that you invest. The investments referred to in this article may not be suitable for all investors, and if in doubt, an investor should seek advice from a qualified investment adviser.
Full performance can be found on the company or index summary page on the interactive investor website. Simply click on the company's or index name highlighted in the article.