Are JD Sports shares on track to race above 900p?
Compared with high street peers, JD has had a phenomenal year. This analyst gives his view on potential.
23rd December 2019 08:53
by Alistair Strang from Trends and Targets
Compared with high street peers, JD has had a phenomenal year. This analyst gives his view on potential.

JD Sports Fashion PLC (LSE:JD.)
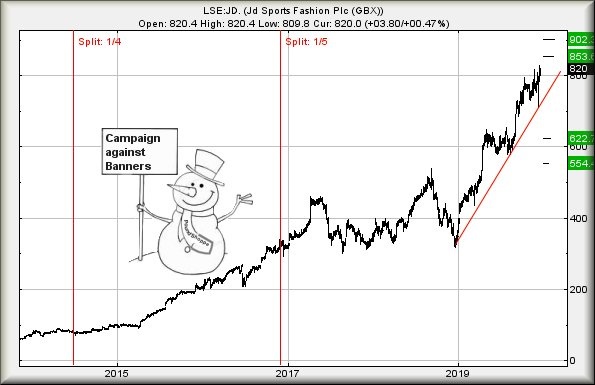
JD Sports (LSE:JD.) have experienced a truly impressive rise in share price since 2014 and normally we'd be concerned about the recent hiatus in climbing potentials.
There are early signs this hesitation is about to ease as movement now above 830p calculate with the potential of an initial 853p. If exceeded, our secondary works out at a longer term 902p.
We cannot calculate higher than 902p but would stress, especially in the case of JD's, this historically means little and it shall be worth keeping an eye out for the market gapping the share price up anytime now.
This will tend to suggest 902p as proving extremely valid, perhaps a point where some hesitation may occur, but we'd need take another hard look at the tea leaves at such a level.
Presently trading around 820p, the price needs go below 720p before alarm is justified as this will indicate the immediate uptrend has failed.
Additionally, it allows future reversal to commence down to 622p initially with secondary, if broken, at 554p and hopefully a proper rebound.
For now, it appears optimism shall be justified.

Source: Trends and Targets Past performance is not a guide to future performance
Alistair Strang has led high-profile and "top secret" software projects since the late 1970s and won the original John Logie Baird Award for inventors and innovators. After the financial crash, he wanted to know "how it worked" with a view to mimicking existing trading formulas and predicting what was coming next. His results speak for themselves as he continually refines the methodology.
Alistair Strang is a freelance contributor and not a direct employee of Interactive Investor. All correspondence is with Alistair Strang, who for these purposes is deemed a third-party supplier. Buying, selling and investing in shares is not without risk. Market and company movement will affect your performance and you may get back less than you invest. Neither Alistair Strang, or interactive investor will be responsible for any losses that may be incurred as a result of following a trading idea.
Alistair Strang has led high-profile and "top secret" software projects since the late 1970s and won the original John Logie Baird Award for inventors and innovators. After the financial crash, he wanted to know "how it worked" with a view to mimicking existing trading formulas and predicting what was coming next. His results speak for themselves as he continually refines the methodology.
Alistair Strang is a freelance contributor and not a direct employee of Interactive Investor. All correspondence is with Alistair Strang, who for these purposes is deemed a third-party supplier. Buying, selling and investing in shares is not without risk. Market and company movement will affect your performance and you may get back less than you invest. Neither Alistair Strang or Interactive Investor will be responsible for any losses that may be incurred as a result of following a trading idea.
These articles are provided for information purposes only. Occasionally, an opinion about whether to buy or sell a specific investment may be provided by third parties. The content is not intended to be a personal recommendation to buy or sell any financial instrument or product, or to adopt any investment strategy as it is not provided based on an assessment of your investing knowledge and experience, your financial situation or your investment objectives. The value of your investments, and the income derived from them, may go down as well as up. You may not get back all the money that you invest. The investments referred to in this article may not be suitable for all investors, and if in doubt, an investor should seek advice from a qualified investment adviser.
Full performance can be found on the company or index summary page on the interactive investor website. Simply click on the company's or index name highlighted in the article.