ii investment review: Q3 2021
Amid the continued global recovery from Covid-19, commodities was the best-performing asset class.
15th October 2021 16:08
by Tracy Zhao from interactive investor
Amid the continued global recovery from Covid-19, commodities was the best-performing asset class.

Market round-up
The global recovery from the Covid-19 pandemic continued, prompting demand to rise and pushing the supply chain to the limit in certain industries. In the third quarter, the best-performing asset class was commodities, advancing 9.9% and lifting year-to-date gains to 38.4%. A hawkish shift from central banks and continuing inflationary pressure saw global inflation-linked bonds return 3.1% on the back of concerns over rising inflation levels.
Developed market equities posted a small gain of 2.4%, while emerging market equities were hit hard with a loss of 5.8%, wiping out the gains made in the first half of the year.
- Check out our award-winning stocks and shares ISA
- Subscribe to the ii YouTube channel for our latest interviews
There was a touch of improvement in the global bond market, with high yield and corporate bonds rising by 2.1% and 1.6%.
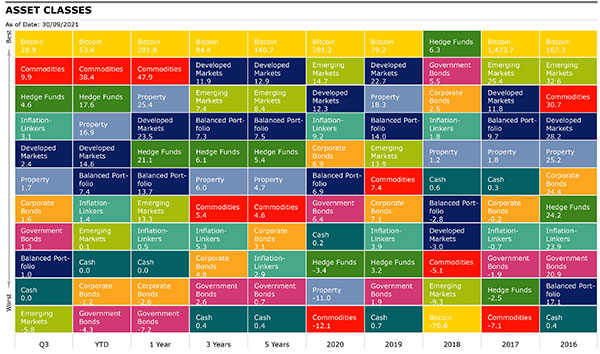
Source: Morningstar Total returns in sterling
Shares
Strong momentum in September lifted Japanese equities’ gains over the third quarter, with a return of 7.3%. Japan was the best performer among developed markets.
In second place were US equities, with the S&P 500 index delivering a gain of 3.1%, mainly driven by strong earnings in August. However, concerns over economic growth and inflation weighed on the US market in September.
Performance of the energy sector helped the UK equity market, with the FTSE All Share up 2.2%. Eurozone equities traded sideways, dragged down by consumer discretionary despite the strong returns in the energy and information technology sectors.
Driven by a significant sell-off in China, Asia ex-Japan equities suffered a sharp decline of 6.2% during the period, as well as writing 5.8% off emerging market equities, as concerns over the credit risk of property group Evergrande (SEHK:3333) spread globally.
| Q3 | YTD | 1 Year | 3 Years | 5 Years | |
| FTSE All Share | 2.23 | 13.56 | 27.89 | 3.08 | 5.36 |
| FTSE 100 | 1.96 | 13.08 | 25.36 | 1.97 | 4.58 |
| FTSE 250 | 3.49 | 14.17 | 35.69 | 6.78 | 7.86 |
| FTSE Small Cap | 2.29 | 22.18 | 51.74 | 11.72 | 11.59 |
| Europe Ex UK | 0.50 | 10.96 | 20.94 | 8.40 | 9.41 |
| S&P 500 | 3.05 | 17.52 | 24.65 | 14.71 | 16.03 |
| Asia Pacific Ex Japan | -6.16 | -0.79 | 11.79 | 7.96 | 9.05 |
| TOPIX Japan | 7.34 | 7.59 | 15.64 | 5.68 | 8.47 |
| Emerging Markets | -5.84 | 0.12 | 13.34 | 7.38 | 8.42 |
| Brazil | -18.23 | -10.47 | 16.00 | -0.31 | 1.86 |
| China | -16.16 | -15.52 | -11.15 | 4.77 | 8.31 |
| India | 15.34 | 28.25 | 46.81 | 15.96 | 12.39 |
| Russia | 12.22 | 32.87 | 52.81 | 15.20 | 15.68 |
| World | 2.45 | 14.60 | 23.51 | 11.89 | 12.90 |
Sectors
In the global market, the financials and energy sector were the standout winners in the third quarter, with returns of 4.6% and 3.8% respectively, reflecting the surging demand for energy and the expectation of rising interest rates in the coming months. The worst-hit sector was materials, a loss of 2.7%, as industry-wide raw material availability issues persisted, casting a shadow over the ability to fully meet high demand.
| Q3 | YTD | 1 Years | 3 Years | 5 Years | |
| Consumer Discretionary | 1.11 | 10.28 | 21.19 | 15.86 | 16.64 |
| Consumer Staples | 0.55 | 4.66 | 5.33 | 7.20 | 5.50 |
| Energy | 3.80 | 35.94 | 62.95 | -8.11 | -1.31 |
| Financials | 4.59 | 24.91 | 46.48 | 7.78 | 11.07 |
| Health Care | 3.49 | 12.56 | 13.73 | 10.81 | 11.71 |
| Industrials | 0.57 | 11.66 | 21.79 | 8.36 | 10.61 |
| Information Technology | 3.91 | 16.25 | 24.12 | 24.64 | 25.89 |
| Materials | -2.67 | 7.17 | 17.35 | 9.20 | 10.67 |
| Real Estate | 1.93 | 17.80 | 21.04 | 7.78 | 5.72 |
| Communication Services | 2.17 | 17.95 | 28.94 | 18.01 | 10.48 |
| Utilities | 1.38 | 0.09 | 3.43 | 7.18 | 6.50 |
Bonds
The bond market experienced a small recovery, and this could be a sign of shrinking risk appetite. The market was pricing in that the inflation would stay at least for the near term, reflected by global inflation linkers returning 3.1%, while UK Inflation Linkers rose 2.3%. However, UK Gilts and Sterling Corporates declined by 1.8% and 0.1%, respectively, as increased expectations for monetary policy tightening pushed yields higher.
| Q3 | YTD | 1 Year | 3 Years | 5 Years | |
| Global Aggregate | 1.55 | -2.74 | -4.99 | 3.09 | 1.23 |
| Global Government | 1.30 | -4.34 | -7.23 | 2.64 | 0.65 |
| UK Gilts | -1.84 | -7.40 | -6.81 | 2.99 | 1.17 |
| Global Corporate | 1.63 | -1.17 | -2.59 | 4.78 | 3.10 |
| Sterling Corporate | -0.96 | -3.41 | -0.30 | 4.52 | 2.65 |
| EURO Corporate | 0.21 | -4.36 | -3.75 | 1.41 | 1.52 |
| Global High Yield | 2.10 | 3.53 | 5.28 | 5.29 | 5.28 |
| Global Inflation Linked | 3.08 | 1.36 | 0.54 | 5.30 | 2.95 |
| UK Inflation Linked | 2.33 | -0.70 | 0.46 | 6.24 | 3.19 |
Commodities and alternative investments
Crude oil and commodities advanced further in the third quarter, bringing the year-to-date return to 53.7% and 38.4%, respectively, as demand continued to surge. Property also had as strong quarter on the back of stronger consumer confidence as economies re-open.
| Q3 | YTD | 1 Year | 3 Years | 5 Years | |
| UK REITs | 4.82 | 16.06 | 32.04 | 4.94 | 4.66 |
| Gold | 0.89 | -7.21 | -11.88 | 12.25 | 4.66 |
| Brent Crude Oil | 7.08 | 53.67 | 83.85 | -2.81 | 9.05 |
| Global Infrastructure | 3.98 | 8.44 | 17.98 | 5.51 | 5.17 |
| Global Natural Resources | -0.35 | 18.27 | 36.37 | 3.47 | 8.70 |
| Commodity | 9.93 | 38.35 | 47.88 | 5.39 | 4.59 |
| Hedge Funds | 4.15 | 17.10 | 20.60 | 5.93 | 5.31 |
| Cash | 0.01 | 0.04 | 0.05 | 0.39 | 0.39 |
| CBOE Market Volatility (VIX) | 46.01 | 0.53 | -17.97 | 21.64 | 10.34 |
Most-traded shares on the ii platform in Q3 2021
These articles are provided for information purposes only. Occasionally, an opinion about whether to buy or sell a specific investment may be provided by third parties. The content is not intended to be a personal recommendation to buy or sell any financial instrument or product, or to adopt any investment strategy as it is not provided based on an assessment of your investing knowledge and experience, your financial situation or your investment objectives. The value of your investments, and the income derived from them, may go down as well as up. You may not get back all the money that you invest. The investments referred to in this article may not be suitable for all investors, and if in doubt, an investor should seek advice from a qualified investment adviser.
Full performance can be found on the company or index summary page on the interactive investor website. Simply click on the company's or index name highlighted in the article.