ii Investment Outlook: Q2 2019
One market is miles ahead of the rest in 2019. Find out who it is and how other asset classes did in Q2.
24th July 2019 11:48
by Lee Wild from interactive investor
One market is miles ahead of the rest in 2019. Find out who it is and how other asset classes did in Q2.

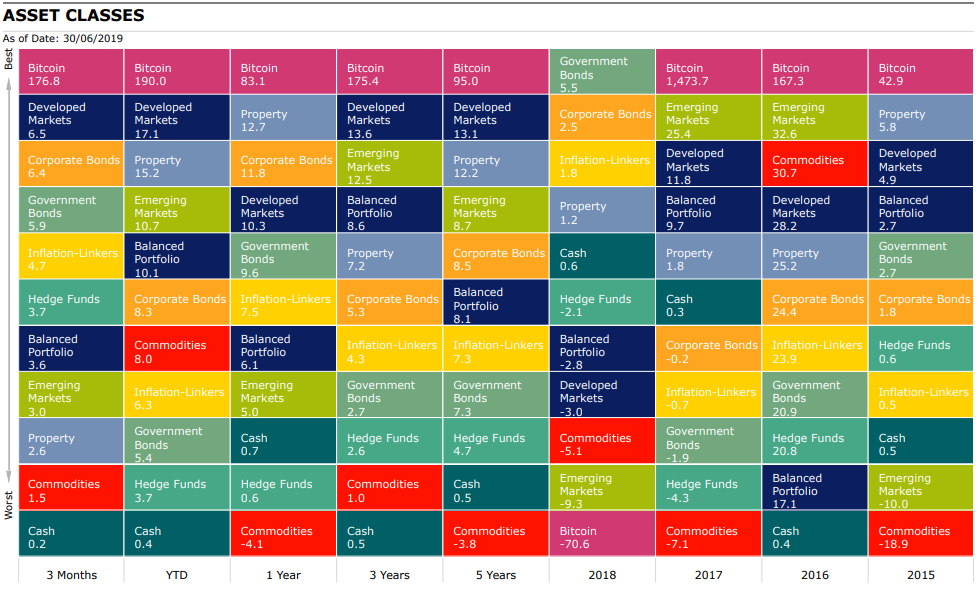
Market round-up
After a truly remarkable first quarter during which many of the major indices racked up percentage gains deep into double-digits, it was no surprise that some of the heat came out of equity markets in Q2, especially in China.
There's still no end in sight to the ongoing and hugely disruptive trade spat between the US and the Chinese, some high-profile sectors remain overvalued, Brexit rumbles on, global economic growth is slowing, and fear of recession amid a stale bull market late in the economic cycle refuses to go away.
However, there were further gains for many of the main markets, and there is currently talk of a so-called summer 'melt-up'. This would see equity markets keep heading higher during the less-liquid holiday season. But this can only happen if certain conditions are met.
An acceptable resolution of the US-China trade war is the preferred outcome, but avoidance of any fresh escalation would probably be taken positively by markets. US second-quarter earnings season, already well underway, must also deliver growth in earnings per share of 1-2%, according to Wall Street consensus. Improvement in global economic growth would allay fears around a late-cycle slowdown, while markets will want a more dovish Federal Reserve to do as it has hinted and cut US interest rates.
Achieving all of this in the weeks and months ahead is a big ask. 2019 has already proved highly lucrative for stock market investors brave enough to buy at the nadir in December and early January. US political influence is also likely to come to the fore during the remainder of this year and ahead of US presidential elections in November 2020.
Source: Morningstar Total returns in sterling
Shares
Despite looking exhausted by efforts at the start of 2019, US markets made fresh highs in the second quarter and have extended deeper into virgin territory early in the second half. The main indices made gains of 2.5-4% in Q2. Excitement around Walt Disney's (NYSE:DIS) streaming service to rival Netflix (NASDAQ:NFLX) had its share price up 26% last quarter. Walmart (NYSE:WMT), American Express (NYSE:AXP) and JP Morgan (NYSE:JPM) were in demand too. Many tech shares took a breather, but Microsoft (NASDAQ:MSFT) is smashing record highs and Facebook (NASDAQ:FB), which is resolving government-scrutiny issues and launching its own cryptocurrency Libra, is near a new best.
But star performer in 2019 so far is Russia. After a 12% rally in Q1, Moscow added a further 15% the following three months. Russian companies are paying bigger dividends, oil prices have benefited the country’s many resource plays, while Bank of Russia interest rate cuts are tipped to boost the local economy.
Investors in Brazil, up almost 6%, did well, too. The election last year of right-winger Jair Bolsonaro – often called the 'Trump of the tropics' – could see a clampdown on corruption, pursuit of free-market policies, pension reform and a sharp uptick in economic growth next year.
Elsewhere, upside was more modest, with mid-single-digit percentage gains being the average. UK indices were among the quarter's worst performers, with blue-chips and mid-caps making only modest gains, while AIM and small-cap shares fell out of favour. A contest to become not only Tory Party leader but also British prime minister, has implications for the local economy and guaranteed a very unsettling period for the country. It’s still unclear if Brexit happens on 31 October or not. It does mean that many shares look cheap for brave investors.
| Performance | |||||
|---|---|---|---|---|---|
| Q2 (%) | YTD | 1 Year | 3 Years | 5 Years | |
| Russia* | 19.64 | 31.17 | 31.80 | 22.86 | 11.06 |
| Brazil* | 9.73 | 15.98 | 44.64 | 19.53 | 7.83 |
| Europe Ex-UK* | 8.34 | 16.96 | 7.26 | 11.82 | 8.11 |
| S&P 500 | 6.79 | 18.62 | 14.54 | 16.07 | 17.45 |
| FTSE 100 | 3.33 | 13.14 | 1.56 | 8.89 | 6.07 |
| FTSE All Share | 3.26 | 12.97 | 0.57 | 9.00 | 6.31 |
| Asia Pacific Ex-Japan* | 3.11 | 12.32 | 4.58 | 13.18 | 10.56 |
| Emerging Market* | 3.01 | 10.66 | 4.99 | 12.49 | 8.72 |
| FTSE Small Cap | 2.95 | 9.37 | -2.03 | 10.89 | 7.72 |
| FTSE 250 | 2.94 | 12.97 | -3.82 | 9.11 | 7.25 |
| India* | 2.90 | 7.77 | 11.97 | 12.35 | 11.85 |
| TOPIX Japan | 2.71 | 7.21 | -2.13 | 10.00 | 11.53 |
| China* | -1.73 | 13.04 | -3.24 | 16.22 | 13.91 |
| Source: Morningstar *MSCI Total returns in sterling | |||||
Sectors
More economically-sensitive (cyclical) sectors such as Financials, IT, Consumer Discretionary and Materials all generated robust gains. Healthcare remains challenged by potential changes to pricing legislation, and more defensive areas of the market made modest gains. Energy stocks were the worst performers for the quarter.
| Performance | |||||
|---|---|---|---|---|---|
| Q2 (%) | YTD | 1 Year | 3 Years | 5 Years | |
| Financials | 8.69 | 15.16 | 5.62 | 14.69 | 11.27 |
| Information Technology | 8.40 | 26.68 | 16.89 | 26.57 | 23.66 |
| Consumer Discetionary | 7.86 | 18.27 | 9.36 | 16.24 | 15.72 |
| Industrials | 7.25 | 19.90 | 10.41 | 13.49 | 13.17 |
| Materials | 7.24 | 17.44 | 4.24 | 14.20 | 9.34 |
| Comm Services | 6.93 | 16.56 | 18.92 | 3.80 | 9.08 |
| Consumer Staples | 5.22 | 15.17 | 14.18 | 6.07 | 12.27 |
| Utilities | 4.97 | 12.88 | 18.59 | 8.65 | 11.53 |
| Health Care | 3.92 | 9.84 | 14.98 | 10.28 | 13.91 |
| Real Estate | 2.91 | 16.70 | 14.15 | 7.59 | 12.29 |
| Energy | 0.79 | 12.74 | -7.74 | 4.41 | 0.28 |
| Source: Morningstar Total returns in sterling | |||||
Bonds
Government bond yields fell markedly as prices rose amid concerns of global economic weakness. Corporate bond markets delivered positive total returns and performed better than government bonds.
| Performance | |||||
|---|---|---|---|---|---|
| Q2 (%) | YTD | 1 Year | 3 Years | 5 Years | |
| Global Corporate | 6.38 | 8.26 | 11.83 | 5.31 | 8.49 |
| EURO Corporate | 6.11 | 5.16 | 6.07 | 4.91 | 5.04 |
| Global Government | 5.94 | 5.38 | 9.61 | 2.74 | 7.27 |
| Global Aggregate | 5.76 | 5.64 | 9.80 | 3.30 | 7.36 |
| Global High Yield | 5.33 | 9.65 | 11.54 | 9.03 | 10.23 |
| Global Inflation Linked | 4.65 | 6.28 | 7.51 | 4.31 | 7.35 |
| UK Inflation Linked | 2.07 | 8.06 | 8.89 | 5.79 | 9.28 |
| Sterling Corporate | 2.04 | 6.31 | 5.97 | 4.02 | 5.47 |
| UK Gilts | 1.31 | 4.74 | 4.90 | 1.96 | 5.54 |
| Source: Morningstar Total returns in sterling | |||||
Commodities and Alternative investments
Oil declined despite a rise in geopolitical tensions in the Persian Gulf. Gold rose to six-year highs due to weaker US dollar and geopolitical issues.
| Performance | |||||
|---|---|---|---|---|---|
| Q2 (%) | YTD | 1 Year | 3 Years | 5 Years | |
| CBOE Market Volatility (VIX) | 12.62 | -40.64 | -2.78 | 0.44 | 11.86 |
| Gold | 12.06 | 10.34 | 17.23 | 4.07 | 7.65 |
| Global Infrastructure | 7.86 | 20.23 | 16.36 | 10.58 | 11.21 |
| Hedge Funds | 4.22 | 3.57 | 5.39 | 6.21 | 9.93 |
| Global Natural Resources | 3.71 | 13.92 | -0.43 | 13.20 | 6.87 |
| Global REITs | 2.59 | 15.17 | 12.70 | 7.19 | 12.23 |
| Commodities | 1.47 | 7.96 | -4.10 | 1.02 | -3.76 |
| Cash | 0.19 | 0.36 | 0.71 | 0.47 | 0.49 |
| Brent Crude Oil | -0.37 | 23.79 | -13.10 | 12.06 | -4.48 |
| UK REITs | -1.95 | 9.12 | -6.01 | 4.12 | 4.16 |
| Source: Morningstar Total returns in sterling | |||||
ii Super 60 fund selections
Super 60 funds continue to perform in line with expectation in absolute and relative terms. Performance over longer terms is very strong. All funds delivered a positive returns year to date. 87% of funds are in 1st & 2nd quartile vs peers over 3 years and 88% - over 5 years. 70% of active managers outperformed their benchmark over 3 years & 76% - over 5 years.
In Q2 Man GLG Continental European Growth was the best performing fund, up 12.4%, followed by iShares Physical Gold ETC (LSE:SGLN) 11.3% which was the lowest returning fund in Q1, and FP CRUX European Special Sits 10.1%.
While Fidelity China Special (LSE:FCSS) was the best performing fund in Q1, it was hit in Q2 as Chinese equities suffered due to concerns over the US-China trade war. Other lowest returning funds over the quarter were WisdomTree Enhanced Cmdty ETF (LSE:WCOM) and Schroder Income Growth (LSE:SCF). The top performer over five years is Baillie Gifford Shin Nippon (LSE:BGS), which returned 23.3% annualised. Other funds which posted strong performance over the same period include Legg Mason IF Japan Equity, Fundsmith Equity and Scottish Mortgage (LSE:SMT).
Top five ii Super 60 funds in Q2
| Investment | 3 Months | YTD | 1 Year | 3 Years | 5 Years |
|---|---|---|---|---|---|
| Man GLG Continental Europe | 12.4 | 23.9 | 1.9 | 13.5 | 16.3 |
| iShares Physical Gold ETC | 11.3 | 9.9 | 16.6 | 3.6 | 7.3 |
| FP CRUX European Special Situations | 10.1 | 17.1 | 1.4 | 10.3 | 10.8 |
| LF Lindsell Train UK Equity | 10.0 | 20.6 | 13.2 | 16.2 | 13.8 |
| Castlefield CFP SDL UK Buffettology | 9.5 | 13.7 | 7.3 | 20.1 | 16.1 |
Bottom five ii Super 60 funds in Q2
| Investment | 3 Months | YTD | 1 Year | 3 Years | 5 Years |
|---|---|---|---|---|---|
| Vanguard FTSE UK Equity Income Index Fund | 0.7 | 11.0 | -2.5 | 5.8 | 4.0 |
| Man GLG UK Income Professional | 0.4 | 10.7 | -0.3 | 14.6 | 9.5 |
| Baillie Gifford Shin Nippon | 0.2 | 12.7 | -5.2 | 16.5 | 23.3 |
| Schroder Income | -1.6 | 3.6 | -4.7 | 10.3 | 6.7 |
| Fidelity China Special Situations | -5.0 | 14.9 | -12.8 | 11.5 | 17.1 |
Most-traded funds on the ii platform in Q2
| Most-bought | Most-sold |
|---|---|
| Fundsmith Equity | Scottish Mortgage Investment Trust |
| Scottish Mortgage Investment Trust | Fundsmith Equity |
| LF Lindsell Train UK Equity | Fidelity China Special Situations |
| City of London Investment Trust | City of London Investment Trust |
| Vanguard US Equity Index | LF Lindsell Train UK Equity |
Changes to the ii Super 60 list (under review/developments
No changes were made to the interactive investor Super 60 list of investments during the second quarter of 2019.
These articles are provided for information purposes only. Occasionally, an opinion about whether to buy or sell a specific investment may be provided by third parties. The content is not intended to be a personal recommendation to buy or sell any financial instrument or product, or to adopt any investment strategy as it is not provided based on an assessment of your investing knowledge and experience, your financial situation or your investment objectives. The value of your investments, and the income derived from them, may go down as well as up. You may not get back all the money that you invest. The investments referred to in this article may not be suitable for all investors, and if in doubt, an investor should seek advice from a qualified investment adviser.
Full performance can be found on the company or index summary page on the interactive investor website. Simply click on the company's or index name highlighted in the article.